

Introduction
Investing in the stock market can be a daunting task, especially for those unfamiliar with its fundamental rules. However, the path becomes much more manageable once you grasp these basics and adhere to them while avoiding speculative behaviour. Success boils down to discipline and patience, combined with a deep understanding of the fundamental components of mass psychology. If you complement this knowledge with technical analysis, you’ll refine your skills even further.
One of the most critical aspects of stock market investing is comprehending the emotions driving market movements. Enter the stock market emotions chart—a tool designed to help investors navigate the complex interplay of emotions throughout different market cycles.
The Essence of a Stock Market Emotions Chart
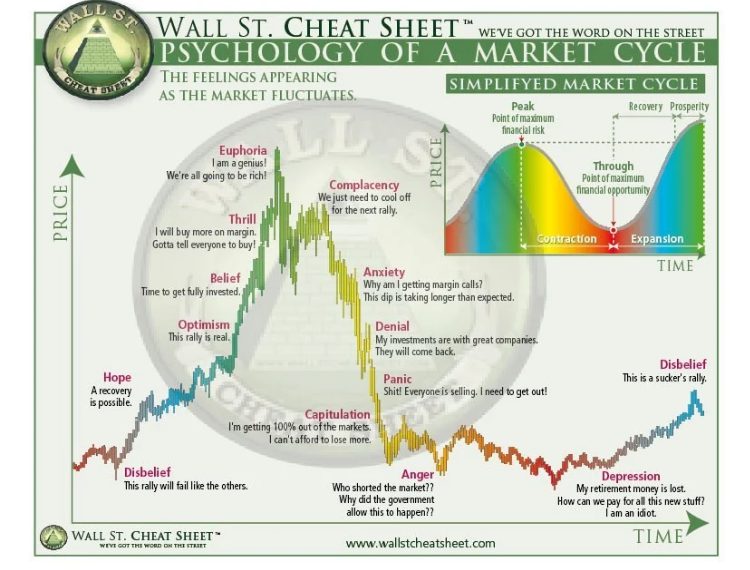
A stock market emotions chart visualises how shifting emotions and sentiments among market participants can influence the progression of a market cycle. These charts depict the dominant psychology at each stage, from widespread pessimism during bear markets to exuberance amid bullish frenzies. The horizontal axis typically represents the extent of market valuation relative to fundamental value, ranging from oversold to overbought extremes. The vertical axis charts the prevailing emotional state, ranging from fear or despair to hope or gratitude.
During periods of optimism, sentiments like denial, hope, and euphoria tend to take hold as prices rise beyond reasonable levels. Conversely, downturns breed emotions like anxiety, fear, and panic on the way down. These predictable progressions from one emotional plateau to another provide contrarian signals.
The Inner Workings of a Stock Market Emotions Chart
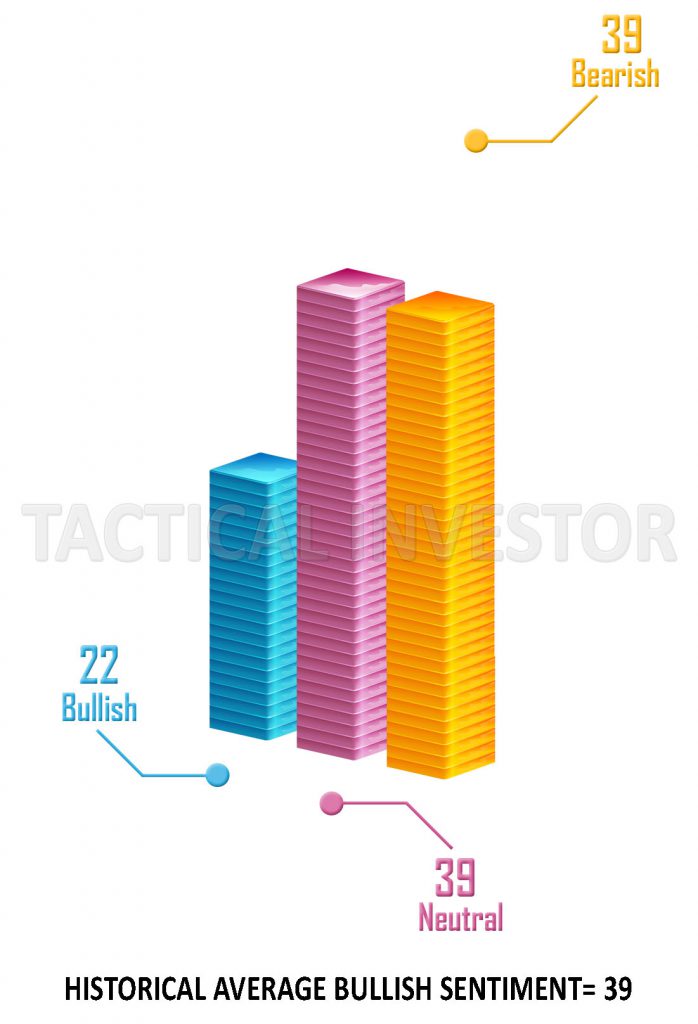
Understanding investor emotions is crucial, as greed and fear create self-fulfilling cycles that influence prices substantially over the long run. A stock market emotions chart monitors these primal emotions through distinct halves representing optimism versus uncertainty.
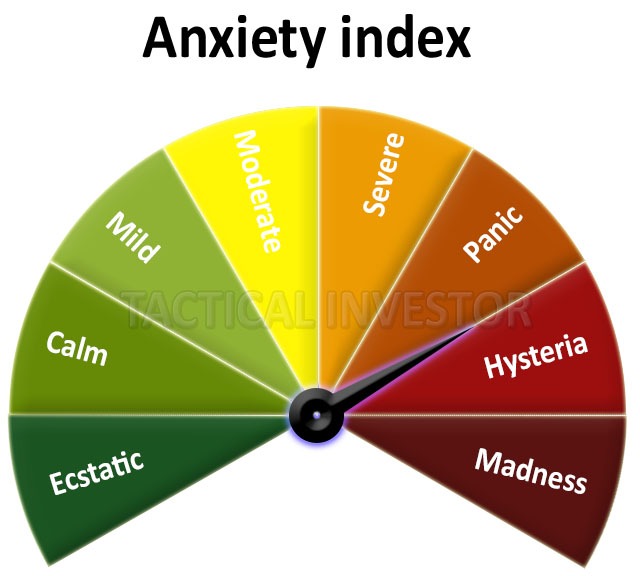
The fear area depicts periods bearing angst, with skittish investors hurriedly exiting equity positions. Major sell-offs frequently coincide with capitulation to the downside, as pessimism breeds even more profound doubts. Monitoring sell-side pressure through expanded volumes and bearish sentiment gauges helps identify points of maximum distress.
Meanwhile, greed involves euphoria and exuberance as excesses emerge on buoyant uptrends—extended rallies birth overconfidence, with investors rationalising lofty valuations driven more by emotional contagion than fundamentals. Distribution events surface as more realistic appraisals of underlying strength take hold.
Benefits of Using Stock Market Emotions Chart
Here are some key benefits of using stock market emotion charts:
- It helps tune out noise and remain objective. By analysing how sentiments evolve, investors can avoid panicking during sharp downturns or exuberance in huge rallies.
- Identifies trend changes earlier. Emotional extremes illustrated on the chart often signal market tops and bottoms before prices fully reverse. This gives a timely heads-up on potential trend changes.
- Prevents chasing momentum. The chart depicts when buying interest switches from fear to greed. This helps traders avoid euphoric, late-stage positions with expensive entries.
- Reduces behavioural biases. Visualising how biases like overconfidence distort thinking at peaks encourages more rational decision-making aligned with fundamentals.
- Promotes contrarian thinking. Recognising when prevailing views have become too optimistic or pessimistic inspires trades, countering the herd for superior risk adjustment.
- Enhances portfolio discipline. Using sentiment as an additional factor fosters systematic processes for rebalancing exposures rather than panicked reactions to short-term swings.
- Highlights multi-year cycles. Charts illustrate recurring patterns of emotion during the bull and bear eras, helping form realistic long-term expectations.
Common Emotions That Drive Market Movements
In addition to fear, greed, optimism, pessimism, and panic, several other emotions significantly influence market movements. These include hope, regret, pride, and overconfidence.
Hope is a powerful emotion that can lead investors to hold onto losing positions for too long, believing that the market will eventually turn around. This can result in significant losses if the market continues to decline.
Regret, on the other hand, can cause investors to sell winning positions too early out of fear that they will lose their gains. This can prevent them from fully capitalising on successful investments.
Pride and overconfidence can also be detrimental. Investors who are overly confident in their abilities may take on too much risk, leading to potential losses. They may also ignore warning signs and fail to adequately diversify their portfolios, putting them at greater risk of significant failure.
Finally, the herd mentality, an individual’s tendency to follow a larger group’s actions, can also drive market movements. This can lead to market bubbles and crashes as investors collectively rush to buy or sell.
Understanding these emotions and how they influence investment decisions is crucial for anyone in the stock market. By recognising and managing these emotions, investors can make more rational and successful investment decisions.
In conclusion, the stock market emotion chart is an indispensable tool for any investor navigating the intricate and emotionally charged realm of stock market investing. It offers invaluable insights into the emotional dynamics that significantly influence market movements. By understanding and leveraging these dynamics, investors can enhance their chances of success in this volatile world.
Other Articles of Interest

Blackrock geopolitical risk dashboard

Harnessing the Positive Divergence Vector Field

What Is Normalcy Bias Hiding from Smart Traders?

JetBlue Carl Icahn’s High-Stakes Airline Gambit

The Greater Fool Theory Newsroom: Illuminating Financial Fallacies

Steven Fiorillo Dividend Harvesting: Revolutionizing Portfolio Growth