

Updated 10 June 2024
Uranium futures price chart: Is Uranium Ready To Rally
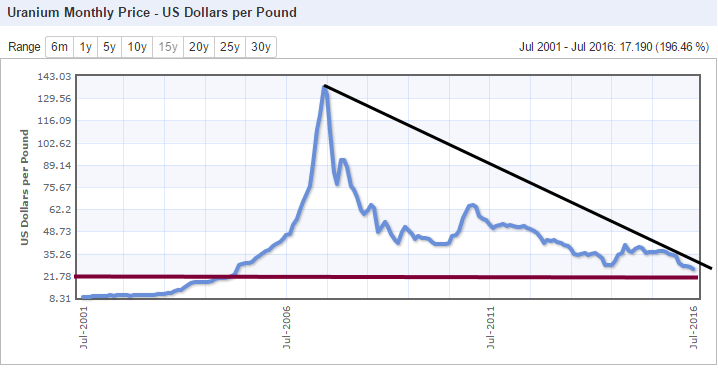
By any estimate, the uranium market is trading in the extremely oversold ranges, but when the trend is down, a market can trend into the extreme of extremely oversold ranges, and we have seen this occur many times in the past. The 15-year chart illustrates that the next layer of support comes into play in the $21.50-$22.00 ranges, so despite being extremely oversold, the market still has room to trend lower. One positive is that the trend is about to turn neutral, and if it does, it would be the first move into the neutral zone in a very long time.
Source:www.indexmundi.com/
Taking a long-term view, a monthly close above $35 would be needed to indicate that a multi-month bottom is in place. From a contrarian perspective, uranium would start to look quite tempting at any level below $23.00.
Source:www.indexmundi.com/
On the five-year chart, Uranium has broken through former support (27.50-28.00) and turned resistance, and it appears that almost all the ingredients are in place for a test of the $21.50- $22.00 range.

Fundamentals Relating To Uranium Price
Uranium costs about $60 a pound, yet mining companies can barely get $30.00 a pound for it. At some point, something has got to give, and that will most likely be mine. More and more mines will close up shop and call it quits, and it is not easy to bring an offline mine online again; it takes time to get an inactive mine back online.
Countries like Japan, Germany and a host of other nations dreaming of giving up on Nuclear energy are well just dreaming. Japan is now re-embracing nuclear, as will Germany and or any other country with hopes to wean itself away from Nuclear power. It is either Nuclear power or Coal, and since these countries claim to be fighting global warming, they will rather embrace Nuclear than coal.
The picture looks quite compelling from a fundamental perspective, but fundamentals tend to paint a falsely positive picture. If we take a look at Cameco, one of the top players in this sector, the technical picture is far from positive. Despite trading in the oversold ranges, the stock broke down after posting a surprise second-quarter loss.
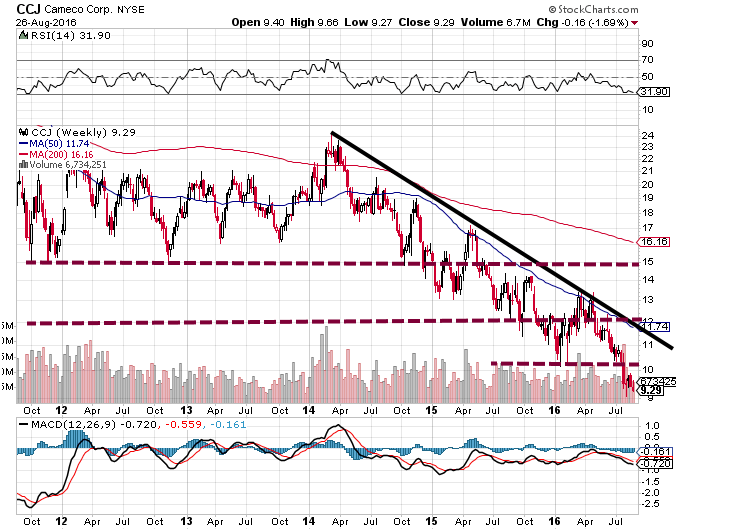
The brown dotted lines represent the multiple levels of support the stock has broken through; in fact, the stock has just traded below is 2004 lows. We would not be surprised if it dipped to $8.50 with a possible overshoot to $7.20 before a long-term bottom takes hold. If uranium trades lower but Cameco’s stock price does not take the same path, it will trigger a positive divergence signals and such signals are usually indicative of a bottom.
Conclusion
Overall, while many factors in the fundamental arena call for a bottom, the technical outlook has improved, and Crowd Psychology illustrates that this sector is still being ignored. The ideal strategy would be to use sharp pullbacks to add to or start a new position.
Courtesy of Tactical Investor
Random views on Uranium Futures price chart
Uranium is a silvery-white metallic element that is malleable, ductile, very dense and naturally radioactive. Uranium has several important industrial applications, but its principal use is as a fissionable material (atoms that can be split apart to release energy) to produce nuclear fuel for electricity generation. Miners worldwide extract about 62,000 metric tons of uranium annually. The quest for cleaner, more environmentally friendly fuels has propelled the nuclear industry’s growth in electricity generation. As a result, uranium has become an increasingly valuable commodity in world markets. How Did Uranium Usage Evolve? Civilizations have used uranium compounds for centuries. Archaeologists found yellow glass with 1% uranium oxide in an ancient Roman villa near Naples, Italy. In the later Middle Ages, glassmakers used pitchblende extracted from silver mines to colour glass. However, chemists didn’t formally isolate uranium as an element until the 19th century. In 1789, a German chemist, Martin Heinrich Klaproth, discovered uranium oxide in the mineral pitchblende. Although he believed the compound contained a new element, he failed to produce uranium. Full Story
Uranium Futures Trading Basics
Uranium futures are standardized, exchange-traded contracts in which the contract buyer agrees to take delivery, from the seller, a specific quantity of uranium (eg. 250 pounds) at a predetermined price on a future delivery date.
Uranium Futures Exchanges
You can trade Uranium futures at the New York Mercantile Exchange (NYMEX).
NYMEX Uranium futures prices are quoted in dollars and cents per pound and are traded in lot sizes of 250 pounds.
Uranium Futures Trading Basics
Consumers and producers of uranium can manage uranium price risk by purchasing and selling uranium futures. Uranium producers can employ a short hedge to lock in a selling price for the uranium they produce while businesses that require uranium can utilize a long hedge to secure a purchase price for the commodity they need.
Uranium futures are also traded by speculators who assume the price risk that hedgers try to avoid in return for a chance to profit from a favourable uranium price movement. Speculators buy uranium futures when they believe that uranium prices will go up. Conversely, they will sell uranium futures when they think its prices will fall. More at https://www.theoptionsguide.com/uranium-futures.aspx
Other Articles of Interest

Is withholding information manipulation?

How do I know my socioeconomic status?

How did the stock market panic 2020 reshape investor strategies?

Could the stock market panic of 1907 happen again?

How does the stock market trend after election affect investments?

How did the GameStop saga of 2021 reshape the stock market?