

Stock Market 2018 Graph: The trend is your friend
Stock market performance 2019: Financial experts continue to state that the markets are going to crash, even though their record since this bull market started back in 2009 has been dismal to the say the least. To complicate matters, some of these same experts suddenly jump ship and start to paint a bullish picture until the markets start to pull back. Then they falsely assume that the markets are going to crash and start singing the “market is going to crash” song again.
![]()
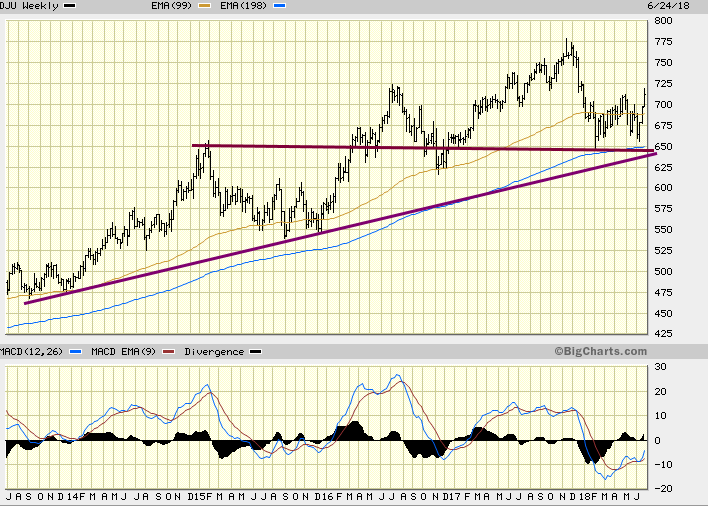
Market sentiment is not extremely bullish, though the bullish sentiment has been trending upwards since Feb of this year. Crowd psychology states that one should only abandon the ship when the masses are euphoric. As that’s not the case, there is no reason to abandon the ship.
The Market has shed some weight, but given the massive run-up, this market has experienced this falls well within the normal ranges of an acceptable correction. In fact, the Dow could drop all the way to 21,500 without having any effect on the trend.
Stock market outlook 2018 still bullish according to TI Dow Theory
Our alternative Dow Theory states that the Dow follows the Utilities and unless the utilities drop to new lows the markets will continue trading within a wide range. The utilities have held up very well when one considers all the outside factors; extremely volatile geopolitical situation (trade wars, disputes with our NATO allies, etc.) and the extremely polarised way the masses are behaving. One would think that we are just one step away from a civil war.
Until the sentiment changes or the utilities drop to new lows, your best bet is to use strong pullbacks to purchase quality stocks.
Most financial experts are closer to clowns than experts, and most financial sites are on par with tabloids; their sole function is to create bombastic titles with little to no subject matter to back their faulty assertions. One would be best served by taking their advice with a barrel of salt and a shot of whiskey.
Focus on Mass Psychology and identify the sentiment that’s driving the masses. The Crowd drives the markets, and if you identify the emotion that’s driving them, you can determine the trend of the market.
Tactical Investor stock market 2018 outlook is also validated by the Dow Transports. Note that they are also holding up well and unless they trade below 9500 on a monthly basis, the outlook will remain bullish. The trend is your friend and everything else is your foe. As the trend is positive, view sharp pullbacks through a bullish lens; the stronger the deviation, the better the opportunity.
Courtesy of Tactical Investor
Random views on Stock Market 2018 Graph
2018 was a record-setting year for stocks, but it’s one investors would rather forget.
The Dow fell 5.6%. The S&P 500 was down 6.2% and the Nasdaq fell 4%. It was the worst year for stocks since 2008 and only the second year the Dow and S&P 500 fell in the past decade. (The S&P 500 and Dow were down slightly in 2015, but the Nasdaq was higher that year.)
December was a particularly dreadful month: The S&P 500 was down 9% and the Dow was down 8.7% — the worst December since 1931. In one seven-day stretch, the Dow fell by 350 points or more six times. This year’s Christmas Eve was the worst ever for the index.
The S&P 500 was up or down more than 1% nine times in December alone, compared to eight times in all of 2017. It moved that much 64 times during the year.
2018 wasn’t all bad. The S&P 500 set an all-time record on September 20, and the Dow closed at its record on October 3. The Dow also closed more than 1,000 points higher on December 26 — the first time it ever accomplished that feat.
But 2018 will be remembered for its extreme volatility. The VIX volatility index spiked, and CNN Business’ Fear & Greed Index has been stuck in “Extreme Fear” throughout much of the year. The Dow has swung 1,000 points in a single session only eight times in its history, and five of those took place in 2018. Full Story
Unlike last year, when the stock market rose steadily — and considerably — in the first quarter, Wall Street has gotten off to a disappointing and disconcerting start in 2018.
As concerns have shifted back and forth from a sluggish economy to an overheating one, the market has taken investors on a roller coaster ride, resulting in poor returns and testing investors’ strategy and resolve.
A SLUGGISH START
Unlike last year, stocks stumbled at the start of 2018.
Making matters worse, there has been no place to hide in the stock market so far this year.
In the first quarter, losses were felt across the board — not only in sectors that performed well at the start of 2017 but in both economically sensitive areas of the market (such as real estate and basic materials) and defensive areas (such as consumer staples and utilities).
Meanwhile, market volatility has come back with a vengeance.
Wall Street strategists typically look at the Chicago Board Options Exchange Volatility Index to judge the rockiness of the market. And by that gauge, which measures fear based on options trading, volatility returned to levels seen in the financial crisis years.
But there’s a simpler way to judge how shaky the market is, and that’s to count the number of days in which stocks climb or fall by 1% or more. In the first quarter of 2018, there were 25 such trading days, more than in any full year since 2009. Full Story
Here are some ingredients for stock-market gloom: A trade dispute between the world’s two largest economies, a Federal Reserve pushing the yield curve toward inversion, and a U.S. president under investigation by an independent counsel.
But enough about 1994.
Seriously, though, investors might want to take a look back at the events of the same year that brought the world Forrest Gump and the founding of a plucky little company called Amazon for a “possible analog” to the current stock market environment, argued Tony Dwyer, analyst at Canaccord Genuity, in a Monday note that highlights the chart below, one that looks somewhat similar to the pattern seen in 2018.
The S&P 500 index SPX, -0.53% fell 1.5% in 1994, according to FactSet, while the index is down 3.9% in the year to date in 2018.
Dwyer emphasized that the backdrops now and in 1994 aren’t exactly alike, but said there are enough similarities between the current political, macroeconomic, Fed policy and market environment to that year to potentially offer some insights.
Moreover, if 1994 and 2018 share similar backdrops, does 1995 offer a guide to 2019? Dwyer noted that after the near-doubling of short-term interest rates in 1994, the first half of 1995 saw just 0.5% annualized gross domestic product growth. The Fed, however, remained worried about inflation and hiked interest rates one more time in February. Full Story
Other Articles of Interest

Black Monday – The stock market crash of 1987

Stock Market Trends

Most Hated Stock Market Bull can’t be stopped by weak economy

Nothing about 1987 stock market crash anniversary

Nickel Stocks Has Put In A long Term Bottom

BitCoin VS Precious Metals

US Dollar Finally Hit Bottom?

Bull and Bear 2019: Which one is the winner?

Buffett Indicator: Pure Nonsense

Experts Are Not Smart Enough to Spot Stock Market Crash 2017

Bear Market nonsense: Experts want you to think Markets are Going to Crash

Identifying Market Trends

Despised Bull Market Will Continue to Trend Higher

The Psychology of Contrarian Investors

Will Bitcoin Crash Chart