Stock Market Crash Stories Experts Push Equate to Nonsense

stock market crash lies

Stock Market Crash Lies Make for Excellent Fables

The lies the media and all the experts were pumping during the sell-off phase (Nov-Dec 2018) was that the crowd had to worry about higher rates and an increasingly hawkish Fed.  And viola, like magic the narrative has changed; now they are talking about a Powell put and how the Fed is turning dovish, which clearly proves two points we have been stating for a long time

  1. Mass Media should be viewed and treated with the same respect one accords to sewage.
  2. The masses (which include the experts) are always on the wrong side of the fence. For the record, these same penguins were stating that the markets were destined to crash last year.

Fear pays Poorly

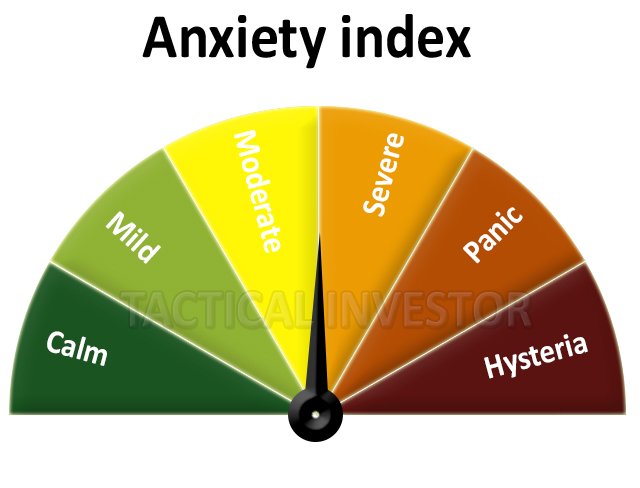
First of all, we hope that the majority of our subscribers are starting to perceive that succumbing to Fear is a dangerous strategy to adopt.  Life and investing should not be stressful; stress is something that every Tactical Investor should abhor.  Moreover, remember, stress comes down to perceptions; alter the perception and one can shift from being stressed to being serene.

Experts love to push the argument that investing is hard and that it takes forever to master this art. Remember that investing is an art, not a science and art is meant to be enjoyed.  So are the masses starting to jump on the bandwagon after this strong turn around; the obvious answer would be yes_? The not so obvious answer would be ___? Continue reading, and you will find out 🙂

Investors are sitting on a massive pile of cash, and it is growing by the day.

The masses panicked when the so-called Santa Claus rally failed to materialise. What they failed to spot was that Santa was providing the astute player with a lovely shopping list and all the goods were on sale.   This January effect was one of the strongest on record and more than makes up for the Santa Claus fail, proving that our stance to remain cool during the so-called December meltdown (opportunity as far we are concerned) was the right posture to take. Santa Claus did not give presents last year, but he provided us with a fantastic list of stocks to buy at a discount price.

To date institutions and individuals have poured billions upon billions of dollars into money market funds. The apparent culprits were; Interest rates, the trade war, government shutdown, Trump investigations and whatever other rubbish you can come up with. Money market assets surged to $3 trillion this January, the highest level since March of 2010, clearly indicating that the masses as always know nothing and jump into the wrong investment at precisely the right time.

Pay close attention to the masses for the data they willingly provide is worth its weight in Gold. Sadly, the masses volunteer for the role of being used as “cannon fodder” over and over again. Try to save them, and they are likely to crucify you to the nearest pole they can find. Watch or read Plato’s allegory of the cave to understand why the masses will never reward anyone that tries to open their eyes.

Common Themes During Stock Market Crashes

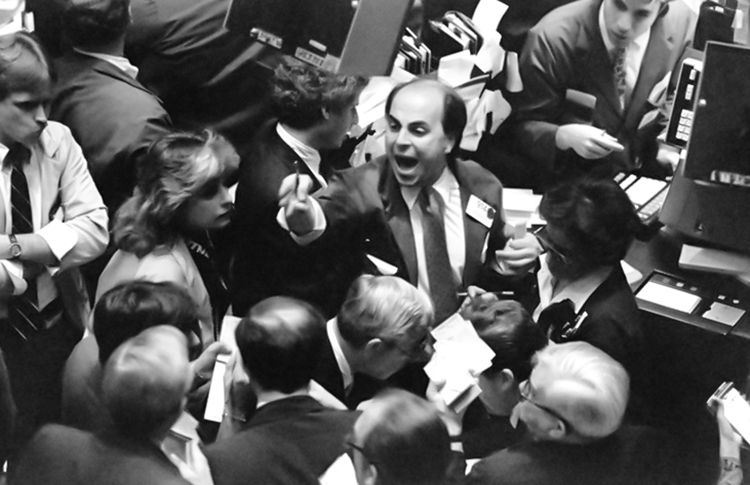
The world is ending, and everyone needs to flee for the hills. The wretched media then diligently create a cocktail on steroids, and serve it to the herd; without fail, they fall for the same ploy over and over again.

“Investors can penalize themselves. While money market funds offer safety, they come at a cost as they accept a lower yield,” said Jerome Schneider, head of short-term portfolio management at PIMCO in Newport Beach, California.

https://www.youtube.com/watch?v=BgQ79evjylc

“I like cash now. You can earn a very reasonable return on cash,” said James Sarni, senior portfolio manager at Payden & Rygel in Los Angeles.

We stated all along that the Fed was lying about inflation and now the truth has emerged. Suddenly Powell is changing his tune. Now he has pledged to be “patient” before raising rates; what gives? B.S that is what gives, the Fed’s only function is to foster boom and bust cycles.

“I worry those investors who have long-term horizons may be hurting themselves,” said Kristina Hooper, global market strategist at Invesco in New York.

As always the masses will wait until the very end, then they will jump in and shortly after that the markets will tank. For the masses, the only possible outcome is pain and loss.  Investors sitting on the sidelines are already paying the price, quality stocks have made a strong comeback from their Dec lows, and the party has just begun.

PIMCO’s Schneider stated the following, and we could not agree more

“They tend to play it safe for too long,”

What Is Our Response To These  Stock Market Crash Stories 

It is rubbish end of story, for the markets have already priced this factor in and the experts are now going to spin gossip into news. At the moment they are still pushing the Tariff wars issue, but it will end on the same note; lots of huffing and puffing but the bad wolf will not be able to blow the house down.  What will knock this bull out? When the masses are ecstatic; until then all the nonsense that is graciously labelled as “news” should be taken with a barrel of salt and a shot of whiskey.

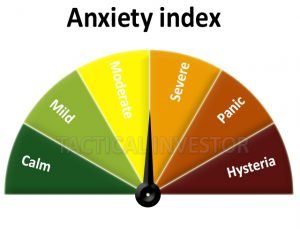
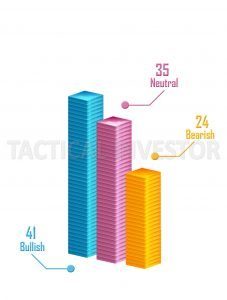
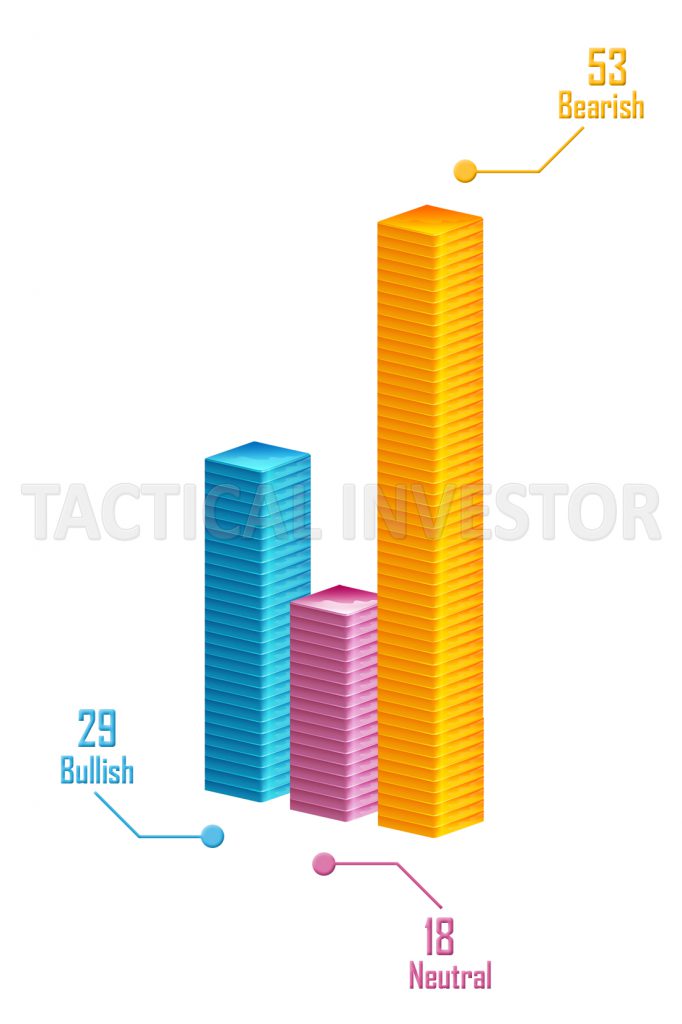
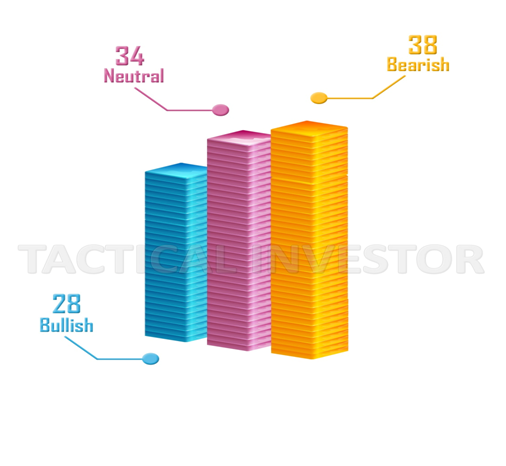
 Despite, the sharp rally the markets have experienced, the masses surprisingly are far from bullish; in fact, the largest number of individuals is in the neutral camp. The current reading; the number of individuals in the neutral camp stands at 37 and bears account for 32; this means that 69% of individuals are still either uncertain or bearish and that has to be viewed as fantastic development. 

Courtesy of Tactical Investor

Random views on Sock Market Lies

Stock Market Facing a 2019 Crash: 70% Correction Warning

July 2019 will mark exactly 10 years since the end of the Global Financial Crisis in 2009. It will also mark the longest period of economic expansion on record, surpassing the 1991 to 2001 internet boom.

The question – Is the current boom sustainable?

The 90s economic boom was fuelled by the internet. This economic recovery has been fuelled by historically low-interest rates and cheap credit – a situation many investors and economists say cannot last.

Warning Signs: The End of the Economic Boom
2018 has been the most volatile year in the stock market since the recession, and volatility can make stock market crises more likely.

The Interest Rates and Financial Crises Relationship
As the US economy firing on all cylinders, the Federal Reserve has increased interest rates eight times since 2015. However, as the US nears full employment, there is an increased danger of rising inflation and consumer prices.

Increasing interest rates is a strategy to curb the rise of inflation – increasing the cost of credit and making saving more attractive strikes a balance between people spending and saving.

However, there are also dangers to this approach. Lower consumer spending has a negative impact on the revenue of consumer-facing businesses. Declining revenue then tightens spending across both the consumer and business landscapes. At the same time, higher interest rates make it harder for financially weak companies to meet their debt obligations. Full Story

A Global Market Crash In 2019? 5 Must-See Charts!

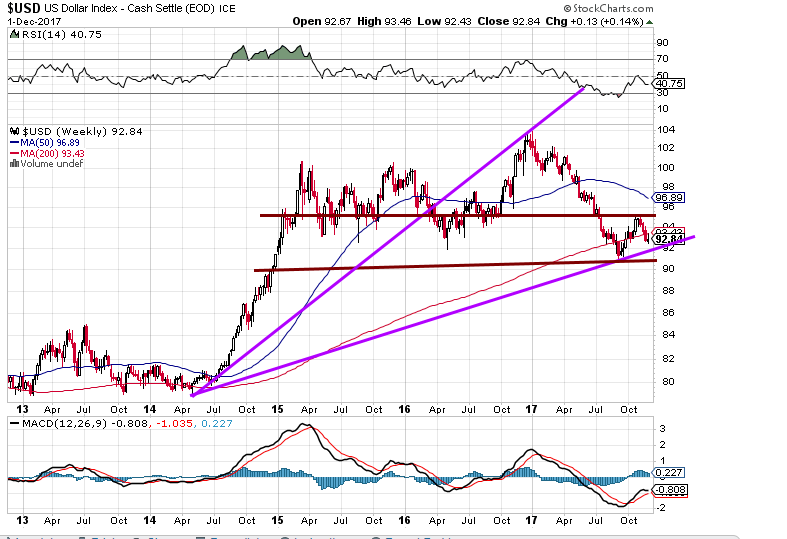
Global markets look shaky. Global stocks were volatile this year, and even U.S. stocks have followed their path lower in recent months. The million dollar question is whether this will result in a global market crash in 2019 or whether this is the end of a weak period. After publishing our Stock Market Crash In 2019 Brewing forecast we now look at global markets. Based on these 5 charts we want to make a point about the probability of a global market crash in 2019, and indicate which leading indicators to watch.

InvestingHaven’s recent analysis of the important and violet global market crashes recent decades shows that any important crash started with weakness in currency and credit markets.

In other words any attempt to forecast a global market crash starts with a thorough analysis of leading currency charts as well as yields.

More specifically we have to look for the long term chart patterns, and structural changes in patterns like reversals from secular support or resistance as well as breakouts or breakdowns from secular trends. This is also the focus in this article, and we do so based on 5 long term charts.

The short answer to our question whether we should prepare for a global market crash in 2019: no we do not see enough evidence as of now of a global market crash in 2019 but some of our leading indicators are visibly deteriorating. Full Story

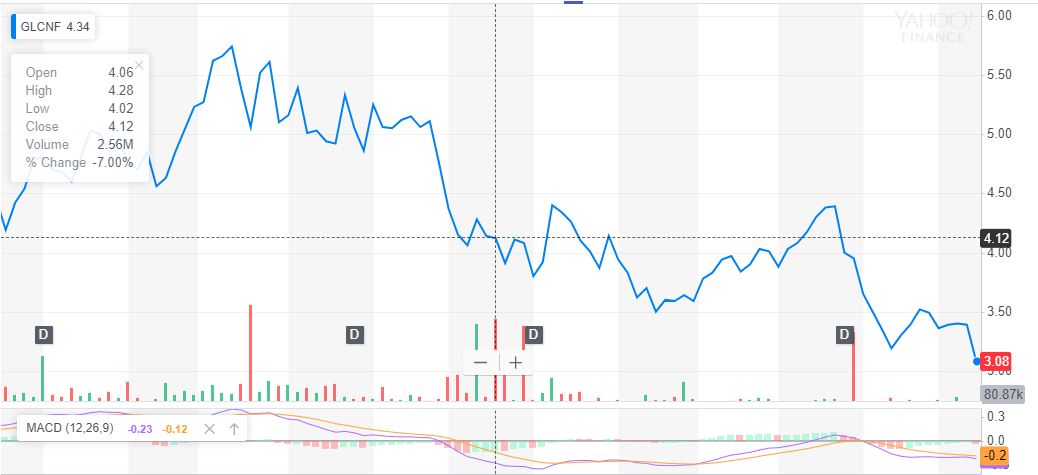
Stock Market Crash Inevitable in 2019: Bitcoin to Rise

Whenever a person buys a bitcoin or any other cryptocurrency, basically you are investing in a market known as the crypto market. Most of the people think that there must be a relation between the current trend of other markets such as the stock market on the crypto market. And if it so, one must be worried about what will happen to the crypto market if the stock market collapse. Also, before that, one must foresee the chances of the stock market to be crashed in the upcoming years.

Well, in this article we will discuss two things which are anyhow interconnected to each other. The first phenomenon that we are going to discuss is the collapse of the stock market in 2019. Is it going to happen and what are the chances of the stock market crash in 2019? In the next section, we will discuss how if the stock market crashes in 2019, it will uplift the crypto market and bitcoin will rise due to it. So, let us first focus on how the collapse of the stock market is inevitable in 2019.

The stock market going to crash in 2019:
It has been ten years that a stock market crashed. As per the trade experts, the stock market is definitely going to collapse this year. The year 2018 itself was one of the worst years for stock market after 2008. Let us have some facts regarding the stock market current scenario: Full Story


Thought-Provoking Chronicles: Stories to Ponder

Which of the following are expressions of overconfidence bias?

Which of the following are expressions of overconfidence bias?

Understanding Overconfidence Bias in Investment Decision-Making Overconfidence bias is a prevalent cognitive bias that significantly impacts investment decisions. This essay ...
Mastering Historical Stock Market Trends

Mastering Historical Stock Market Trends

Understanding Historical Stock Market Trends: A Gateway to Informed Investing Historical stock market trends provide invaluable insights for investors seeking ...
Conquering Your Fear of Investing in Stocks

Conquering Your Fear of Investing in Stocks

Understanding the Fear of Investing in Stocks The fear of investing in stocks is a common psychological barrier that prevents ...
The Dividend Collar Approach: A Smart Way to Invest in the Stock Market

The Dividend Collar Approach: A Smart Way to Invest in the Stock Market

Understanding Dividend Collars A dividend collar strategy involves selling a covered call option and buying a protective put option on ...
Insights from Market Experts on Stock Trading

Insights from Market Experts on Stock Trading

Market Experts: Insights and Strategies for Successful Investing The investing world is complex and ever-changing, making it challenging for even ...
what is the most important aspect of the “greater fool theory” of investing?

What is the most important aspect of the “greater fool theory” of investing?

What Is the Most Important Aspect of the “Greater Fool Theory” of Investing? The “greater fool theory” of investing is ...

Most Hated Stock Market Bull can’t be stopped by weak economy

Most Hated Stock Market Bull can't be stopped by weak economy

The data below serves as further proof that the economic recovery is nothing but an illusion.  It has only benefited those who don’t really need it. The rich have become even richer, the middle class has vanished and the poor are becoming even poorer.


  1. Real incomes have been flat to down slightly for the average household in the bottom 60% since 1980 (while they have been up for the top 40%).
  2. Those in the top 40% now have on average 10 times as much wealth as those in the bottom 60%. That is up from six times as much in 1980.
  3. Only about a third of the bottom 60% saves any of its income (in cash or financial assets).
  4. Only about a third of families in the bottom 60% have retirement savings accounts—e.g., pensions, 401(k)s—which average less than $20,000.
  5. For those in the bottom 60%, premature deaths are up by about 20% since 2000. The biggest contributors to that change are an increase in deaths by drugs/poisoning (up two times since 2000) and an increase in suicides (up over 50% since 2000).
  6. The top 40% spend four times more on education than the bottom 60%.
  7. The average household income for main income earners without a college degree is half that of the average college graduate.
  8. Since 1980, divorce rates have more than doubled among middle-aged whites without college degrees, from 11% to 23%.
  9. The number of prime-age white men without college degrees not in the labor force has increased from 7% to 15% since 1980.  Full Story

What should you do?

Sentiment indicates the masses are not bullish so this market is not ready to crash. Instead of panicking make a list of stocks you would like to own and when the market’s pullback, buy these quality stocks at a huge discount.

Market Sentiment Supports Higher Stock market prices


Permabear meaning – A Special Kind Of A Stupid

Permabear - A Special Kind Of A Stupid One

Being a Permabear is a recipe for disaster.

The meaning of a Permabear, characterized by persistent pessimism about market prospects, is fundamentally flawed and historically disproven. This approach not only defies logic but also contradicts decades of market data. Consider the case of Robert Prechter, a notorious Permabear who predicted a Dow Jones Industrial Average (DJIA) crash to 1000 in 1987. While the market did experience a significant drop that year, it rebounded swiftly and continued its long-term upward trajectory, leaving Prechter’s followers with substantial losses.

Examining any long-term chart of major market indices reveals an undeniable upward trend. For instance, the S&P 500 has shown an average annual return of approximately 10% over the past century, accounting for inflation and dividend reinvestment. This consistent growth pattern renders the Permabear stance not just imprudent but potentially ruinous for long-term investors.

It’s crucial to understand what is bullish divergence in this context. A bullish divergence occurs when the price makes a lower low, but a technical indicator forms a higher low, often signalling a potential trend reversal. Permabears frequently overlook these signals, missing out on significant market rallies. A notable example is the period following the 2008 financial crisis, where numerous bullish divergences appeared in various technical indicators, presaging the strong bull market that followed.

The 100-year chart of the Dow Jones Industrial Average serves as incontrovertible evidence against the Permabear stance. Despite numerous economic downturns, world wars, and financial crises, the overall trajectory remains decisively upward. This chart demonstrates that markets have consistently recovered and surpassed previous highs, rewarding those who maintain a long-term optimistic outlook.

The solution is simple.

Focus on the simple factors, for that is what helps determine the trend; factors such as mass sentiment and extreme patterns (technical analysis) are on the charts.  The news is not an essential factor; in fact, toilet paper has more relevance than news; at least it serves a noble function; one cannot say the same of news.

Anyone who advocates giving into fear should be thrown head first out of the front door(figuratively speaking, that is) and never allowed back into your house or mind. Fear never pays off; only the vendors of fear will make a handsome buck, and the buyers will lose their pants, shirts, and knickers, too.

Marc Faber is a classic example of A PermaBear that is full of rubbish

This dude has predicted prediction calling for the mother of all crashes since the inception of this bull (2009), but the only thing that has crashed so far are his predictions of a crash.  He would probably make a very good science fiction writer, for he seems to spend a lot of time concocting scenarios that have a very low probability of coming to pass.

Here he states that we are going to experience a great recession in 2018

It turns out, once again, that the only recession was in his predictions, which, for now, are the only things that have been in a bear market. Hence, if you are a Permabear on his ability to predict market direction, it could actually pay off.

Then he goes on to state the party is going to end in 2018

Random Musings on Permabear Meaning

The concept of a permabear extends beyond mere pessimism; it represents a deeply ingrained psychological bias that can severely impair investment decisions. This mindset often leads to missed opportunities and financial underperformance. For instance, consider the case of Dr. Marc Faber, known as “Dr. Doom” for his consistently bearish outlook. Despite his reputation, Faber’s predictions have frequently been off the mark, particularly during the bull market that followed the 2008 financial crisis. His persistent bearishness caused many followers to miss out on significant gains in sectors like technology and healthcare.

Fear, the driving force behind the permabear meaning, is a potent but often misguided emotion in investing. Historical data shows that fear-driven market exits typically result in substantial opportunity costs. For example, investors who sold during the market panic of March 2020 missed out on the subsequent rally, where the S&P 500 gained over 100% in the following 18 months. This underscores the importance of maintaining a balanced perspective and not succumbing to fear-based decision-making.

Understanding what bullish divergence is can be a powerful tool in combating the permabear meaning. A bullish divergence occurs when the price makes lower lows, but technical indicators show higher lows, often signalling a potential trend reversal. For instance, during the 2018 market correction, several technical indicators displayed bullish divergences on the S&P 500 chart, preceding a strong rally in 2019. Recognizing such signals can help investors maintain a more balanced and opportunistic approach to market fluctuations.

Stress reduction in investing is not just about emotional well-being; it’s a crucial factor in making sound financial decisions. Research in behavioural finance has shown that stressed investors are more likely to make impulsive decisions and fall prey to cognitive biases. A study by the University of California, Irvine, found that chronic stress impairs decision-making abilities and risk assessment. To combat this, successful investors often employ strategies such as diversification, dollar-cost averaging, and maintaining a long-term perspective, which can help mitigate stress and improve overall investment outcomes.

Experts love to push the argument that investing is hard and that it takes forever to master this art. Remember that investing is an art, not a science and art is meant to be enjoyed.  So are the masses starting to jump on the bandwagon after this strong turn around; the obvious answer would be yes. The not-so-obvious answer would be no. Continue reading. It turns out, at least in the first half of 2019, the not-so-obvious answer would be the right choice. The masses are still nervous, and until they start to dance on the streets, every strong correction should be viewed through a bullish lens.

Conclusion on Permabear Meaning

This bull market is unlike any other; before 2009, one could have relied on extensive technical studies to more or less call the top of a market, give or take a few months; after 2009, the game plan changed, and 99% of these traders/experts failed to factor this into the equation. Technical analysis as a standalone tool would not work as well as it did before 2009 and, in many cases, would lead to a faulty conclusion.  Long story short, there are still too many people pessimistic (experts, your average Joes and everything in between) and until they start to embrace this market, most pullbacks ranging from mild to wild will falsely be mistaken for the big one.

The results speak for themselves; the majority of our holdings were in the red during the pullback, but now they are in the black, proving that one should buy when there is blood flowing in the streets. It is a catchy and easy phrase to spit out but very hard to implement because when push comes to shove, the masses will opt for being shoved.

Courtesy of Tactical Investor


Random views on Permabear

Another warning light is blinking on the dashboard of the US economy. This time it is the inflation-tied Consumer Price Index (CPI) which has the bears scurrying for their bomb shelters. David Rosenberg, a so-called perma-bear, was filling Twitter feeds with his unique brand of doom and gloom for the Dow Jones and wider US stock market.

GLUSKIN SHEFF ECONOMIST: CPI DATA PORTENDS RECESSION

David Rosenberg

Today’s CPI did miss targets against an expectation of a 0.2% increase relative to the 0.1% reading. The Dow Jones is easing gently off its highs today as well, having lost 53.29 points as of the time of writing.

In isolation, that’s a snoozefest, but Mr. Rosenberg did note something particularly interesting about the data as a predictor of recession. Apparently, he is using price pressure as a sort of alternative yield curve.

BOND-YIELD INVERSION: A STRONG INDICATOR OF RECESSION
Given that interest rates are always somewhat interconnected with inflation due to the Fed’s approach to monetary policy, this is not particularly ground-breaking. It is interesting, though, particularly with the bond market teetering on the brink of inversion. Full Story

A prominent Wall Street permabear says the stock market is ‘stoned on free money’ and it could ‘prove fatal’

One prominent strategist says the market is high literally and figuratively. Albert Edwards, global strategist at Société Générale, cautioned on Thursday that stock markets were becoming “stoned on free money,” leaving them “detached from reality.” It’s a condition that the strategist says could “prove fatal,” in the end.

U.S. equity benchmarks — and those across the globe — have roared back from a late-2018 selloff that culminated in one of the worst December returns in years, but Edwards says, in a Thursday note, that those gains have been largely aided by central banks that are willing to “inject another dose of euphoria into its market patch.”

Indeed, since a Dec. 24 low last year, the Dow Jones Industrial Average DJIA, -0.70% and the S&P 500 index SPX, -0.50% have both advanced by about 20%, while the Nasdaq Composite Index COMP, -0.22% has returned about 23%, thus far, as of trading midday Thursday, according to FactSet data.

Easing trade-war tensions between the U.S. and China have helped stocks rebound, but a policy pivot by the Federal Reserve in January arguably delivered the most substantial shift in investor sentiment over recent weeks.

The Fed, headed by Chairman Jerome Powell, said it would be more patient in assessing future rate moves, and minutes of the January gathering released on Wednesday indicated that its efforts to reduce a $4 trillion asset portfolio could conclude as early as the end of 2019. Full Story


Permabear Sentiment Index

Yesterday, I have created a download item that creates an index called the Roubini Sentiment Indicator. The same guys who created this indicator also created another one called the Permabear sentiment index. Permabear refers to people who are always pessimistic and negative about the future direction of the economy and markets. The Permabear sentiment index is built using aggregate keyword volume data from Google Trends. The index is the result of the sum of four Google Trends popularity indices; the keywords used to create these indices are: Roubini, Peter Schiff, Marc Faber and Nassim Taleb.

The item will login in your Google account, load Google trends and create a Google Trends popularity index for each permabear. It will then download the data, parse it, calculate the sum of each permabear volume data and then save the result in ticker symbol: ^GOOGLE_TRENDS_PERMABEAR. As with the Roubini Sentiment Indicator, you must set the email and password fields of this download item to your Google email and password (Select the item, click on Update, click on the “2 Field(s)” button).

The author of the Permabear Sentiment Index claims that the Permabear Sentiment Index can make 3.5% over a short period of 3 weeks compared to the 1.6% yield of the Roubini Sentiment Indicator over the same period. The author gives one reason behind the good performance of this index. Full Story

Contemplative Journeys: Stimulating Articles

Which of the following are expressions of overconfidence bias?

Which of the following are expressions of overconfidence bias?

Understanding Overconfidence Bias in Investment Decision-Making Overconfidence bias is a prevalent cognitive bias that significantly impacts investment decisions. This essay ...
Mastering Historical Stock Market Trends

Mastering Historical Stock Market Trends

Understanding Historical Stock Market Trends: A Gateway to Informed Investing Historical stock market trends provide invaluable insights for investors seeking ...
Conquering Your Fear of Investing in Stocks

Conquering Your Fear of Investing in Stocks

Understanding the Fear of Investing in Stocks The fear of investing in stocks is a common psychological barrier that prevents ...
The Dividend Collar Approach: A Smart Way to Invest in the Stock Market

The Dividend Collar Approach: A Smart Way to Invest in the Stock Market

Understanding Dividend Collars A dividend collar strategy involves selling a covered call option and buying a protective put option on ...
Insights from Market Experts on Stock Trading

Insights from Market Experts on Stock Trading

Market Experts: Insights and Strategies for Successful Investing The investing world is complex and ever-changing, making it challenging for even ...
what is the most important aspect of the “greater fool theory” of investing?

What is the most important aspect of the “greater fool theory” of investing?

What Is the Most Important Aspect of the “Greater Fool Theory” of Investing? The “greater fool theory” of investing is ...

Technology Driven Deflation Will Kill The Inflation Monster

Technology Driven Deflation Will Kill The Inflation Monster

Technology-Driven Deflation

Venture funding for AI is surging as evidenced by the chart below and the trend is showing no signs of letting up; in fact, the trend is so powerful that one can almost start with certainty that technology-driven deflation is going to be a very powerful force to reckon with. Imagine, small companies having the power to do what Amazon does but on a different scale.  For example, flippy the burger bot replaces several workers saving a business up to 100K a year

“We are excited about the impact Miso’s AI-based solutions will have for the restaurant industry. Humans will always play a very critical role in the hospitality side of the business… We just don’t know what the new roles will be yet in the industry.”

The Bot will never get tired, never need uniforms and it’s not going to get sick or complain. Bottom line it is the perfect worker for small business burger joints that are looking to contain their costs and improve their services.  As for the big players are concerned, it has the potential to reduce their overhead by billions.  Last but not least, companies won’t have to worry about paying a minimum wage of up to $15 an hour and providing benefits

USA AI Funding

Little Caeser’s want to create their own Bot

Pizza chain Little Caesars has been awarded a patent for an AI-based robotic system that will help assemble Pizzas at a significantly faster pace. The patent includes two robots, one stationary arm and another fully-fledged robot chef to handle the dough and take care of oven duties.

According to the company’s explanation in the patent, the robot would free Little Caesars from the tedium of repetitive tasks and allow them to “perform other value-added tasks.” Presumably, that’s the same thinking that gave us Flippy, the burger-flipping robot.

It doesn’t appear to actually cook the pizzas or slice them, and the only listed topping is pepperoni — though it probably wouldn’t be hard to adapt it to other toppings. I’m sure there are only so many ways one can “properly distribute” pineapple or olives. Still, there are other robots already doing the things this particular one can’t — Zume Pizza in Silicon Valley, for example, can shape the dough and bake the pizzas at a rate of 372 an hour.

If Little Caesars were to ever combine their robot with Pizza Hut’s self-driving pizza delivery truck, the only human force we’ll ever need will be a single human to load the pizzas into the car. Full Story

Could the pizza bot move like Flippy? Time will tell

“Now he moves like a ninja and is more reliable,” says David Zito, the CEO of Miso Robotics, which created Flippy.

“We’ve been trained since childhood that robotics were coming in the future,” notes Louise Perrin, an accountant who works nearby. “To be a part of it, to see it and watch it happen live in front of you … is absolutely incredible.”

“I had to come in and see Flippy,” she says. “I’d heard the buzz. The concept of a robot flipping your burger is awesome.”

Central Bankers action could Fuel Technology-Driven Deflation

The shrinkage of the U.S. Federal Reserve’s balance sheet has played a significant role in exerting upward pressure on borrowing costs as parts of the U.S. economy have shown signs of decelerating, a study from the Kansas City Federal Reserve released on Wednesday showed.

The model developed for the study showed the level of reserves plays “an important role in determining the federal funds-IOR spread over the medium- and longer-term and that repo rate dynamics play a relatively less important role,” A. Lee Smith, a Kansas City Fed senior economist and the author of the study, wrote. Full Story


The China Factor

It is premature to say China is coursing toward a Japan-like falling-prices drama. Yet recent data warrant a moderately sized blip on investor radar screens. In November, consumer prices slid 0.3% from a month earlier, while producer prices fell 0.2%. On a year-on-year-basis, producer prices advanced just 2.7% in November, the weakest reading in two years (consumer prices are up 2.2% from a year ago).

Bond traders are taking no chances. Earlier this week, 10-year yields dropped to 3.27%, the lowest in more than 18 months. And, really, they have every reason for gloom considering the headwinds blowing China’s way — and how they may intensify next year. Full Story

Courtesy of Tactical Investor

Nothing about 1987 stock market crash anniversary

1987 stock market crash

Stubbornness does have its helpful features. You always know what you’re going to be thinking tomorrow.

Glen Beaman

Expert after expert is busy proclaiming that the world is about to come to grinding halt again.

They never seem to let up on pushing this sewage onto the unsuspecting masses. This is a clear example of insanity in action;  mouthing the same thing over and over again with the desperate hope that this time the outcome will be different.  The outcome will not be different this time, at least not yet. These guys should focus on writing fiction for reality seems to elude them completely. For years we have stated (and rightly so) that until the sentiment changes, this market will continue to soar higher and higher.

Here is a small sample of the flood of articles that were pushed out this month. If one simply glances through them, one would almost be compelled to think that the writers shared the same notes.  There is almost no originality in these articles. The theme is the same, just because it’s October the focus is on the disaster aspect of the 1987 crash. Almost no one mentions that it proved to be a monumental buying opportunity. The focus is oh the financial world came to a grinding halt. Only it did not, the only that came to a halt was the rubbish the predecessors of today’s experts were uttering back in 1987.  This reinforces the view that most financial writers have chosen the wrong profession   One word sums all this nonsense “Rubbish.”

  • Could the 1987 stock market crash happen again? – Reuters
  • Black Monday anniversary: How the 2017 stock market compares with 1987 – Market Watch
  • Black Monday: 30 years after 1987 stock market crash… Wall Street raises fears of REPEAT- express.co.uk
  • Thursday marks 30th anniversary of the Black Monday stock market crash – courier-journal
  • Buy Climax at 30th Anniversary of 1987 Stock Market Crash – Money Show
  • The Crash of ’87, From the Wall Street Players Who Lived It – Bloomberg
  • Black Monday: Can a 1987-style stock market crash happen again? – USA Today

So are we stating that the stock market will never crash?

No that is not what we are stating.  The market will crash, but for the astute investor, “crash” is the wrong word to use. A strong correction is more likely as most astute investors got into this market a long time ago. It is the crowd that will eventually decide to embrace close to the top that will experience this crash that the experts have been hyping about for years.

This market will experience one strong correction before it crashes, but the moment the Dow sheds 1000 points or more these experts will crawl from the rocks they were hiding under and start screaming bloody murder. To which our response is, please scream as loud as you can; for it will push the markets lower creating a better buying opportunity for us.  This is exactly what we said in Aug of 2015 before Trump won and countless times before and after that.

This market is extremely overbought so a pullback ranging from 1500-3000 points should surprise no one and it certainly should not be construed as a crash but viewed as market releasing a well-deserved dose of steam. To state otherwise, would simply be disingenuous, which seems to be the only real qualification these so-called experts posses

.

Market Sentiment indicates that the crowd is far from Ecstatic

Market Sentiment Supports Higher Stock market prices Bullish sentiment is still too low


The Bullish sentiment has risen somewhat, and the crowd is not as anxious as it was at the beginning of this month or last month, but until the readings indicate this crowd is euphoric, a crash is unlikely. Many people state that most people don’t have money to invest in the markets. We beg to differ; look at whats going on in the Bitcoin market, now that is a market showing some signs of Euphoria; the stock market in comparison is at the lukewarm stage.

Buy The  Fear & Sell The Noise 

The only thing that is going to crash and has been crashing since 2008 is the egos of these “know it all” experts. If any of them had even listened to themselves half of the time; they would have bankrupted themselves several times over. The fact that they are still around chiming the same rubbish is clear proof that they don’t believe a word they are putting to print and therefore neither should you.

 Why Not Try Something New For A Change

Make a list of stocks you would love to own at a discount. When the market lets out a nice dose of steam, instead of fleeing for the hills, you can purchase top quality stocks for a discount

The sheer volume of these articles validates our view that the masses are from bullish and a crash is unlikely.  Until the sentiment or the trend changes,  all strong corrections should be viewed through a bullish lens.


Obstinacy is the result of the will forcing itself into the place of the intellect.

Arthur Schopenhauer


Other Articles of Interest

Bear Market nonsense: Experts want you to think Markets are Going to Crash 

Updated 10 June 2024 Are We headed for A Bear Market? The stock market crash story is getting boring and annoying ...
Dollar hits bottom

US Dollar Finally Hit Bottom?

Updated 10 June 2024 The US Dollar Finally Hit Bottom, and Gold could be heading lower Gold USD: The theme ...
uranium futures price

Uranium Futures price chart

Updated 10 June 2024 Uranium futures price chart: Is Uranium Ready To Rally By any estimate, the uranium market is ...
stock market emotions chart

Sophistication in Sentiments: The Stock Market Emotions Chart Explained

Introduction Investing in the stock market can be a daunting task, especially for those unfamiliar with its fundamental rules. However, ...
how to win stock market game

The Artful Approach to Winning the Stock Market Game

Mastering the Art: How to Win the Stock Market Game We delved into this subject a few years back, using ...
permabear

The Permabear Predicament: A Ballet of Bearish Beliefs

Being a permabear is akin to a unique form of folly that even countless harsh lessons fail to rectify. It ...
The Dynamic Approach of Small Dogs Of the Dow

Harnessing Power: The Dynamic Approach of Small Dogs Of the Dow

For those new to the world of investing, the stock market can appear as a daunting labyrinth of stocks and ...
Exploring the Human Mind

Psychology Unveiled: Exploring the Depths of the Human Mind

Ahoy there, fellow explorer! It is an undeniable truth that the emotions within us drive the ebb and flow of ...
hologram of investor and chart

Stock Portfolio Tracker

Live Stock Portfolio Tracker with Analytics Please scroll down and register for an account. If you use the incognito mode, ...
stock market crashes

What happens if the stock market crashes?

The stock market has been a popular investment avenue for individuals and organizations for many years. Despite its popularity, many ...
Intelligent Investing

Achieving Financial Goals with Intelligent Investing Strategies

Intelligent investing strategies seek to minimize risk and maximize returns through the use of thoughtful, data-driven approaches. These strategies aim ...
Stock Market 2018 Graph

Stock market performance 2019

Stock Market 2018 Graph: The trend is your friend Stock market performance 2019: Financial experts continue to state that the ...
quantitative easing definition

Quantitative Easing Definition

Forever Quantitative Easing: Is it here to stay? The term forever QE has just started to come into play recently, ...
hologram of investor and chart

Stock Market Update

Stock Market Watch is our most popular and oldest stock market update service. As numerous upgrades and 2 upgrades are ...
Stock Market Quotes and Sayings

Stock Market Quotes and Sayings

Warren Buffett usually has produced a lot of great stock market quotes in regards to the discipline of investing; his ...
US Dow Jones Stock Outlook

US Dow Jones Outlook

US Dow Jones Stock Market Outlook Huge amounts of money have abandoned the marketplace, suggesting the audience is panicking at ...
Loading...

Nickel Stocks Has Put In A long Term Bottom

nickel stocks

Nickel: Is This The Beginning of A new Bull Market

If you look at a shorter-term chart 1-3 years, it looks like the main move is underway already. However, looking at a ten-year chart, we can see that Nickel is at an important junction. It needs to close above 1100 on a monthly basis; failure to achieve this could push it back down to the 820-855 ranges over rather quickly.  If one is looking for a solid confirmation, then a monthly close over 1200 should do it; this would set the pace for a test of the 1500 ranges with a possibility of trading to 1800.

We looked at several large producers of nickel, and all their charts illustrated that the stocks were consolidating, which suggests that Nickel is likely to pullback before trending higher unless the metal is going to diverge and trend in the opposite direction.

Let’s take a look at some Nickel Producers

VALE, which is the world’s second-largest producer of Nickel, appears to be consolidating while nickel prices trend higher and the same appears to be true of NILSY (Norilsk Mines).  What could be taking place here is that the stocks are pulling back and building energy for the next phase upwards.

On the monthly chart of VALE, we can see that the stock is holding up quite well, while our indicators are letting out some steam. If one were willing to take some risk and wanted to act before our indicators moved into the oversold range capital could be deployed in the 9 to 10 dollar ranges.

The pattern is quite interesting here; this is one of the few stocks in the sector that has not experienced a nice upward move. The other stocks are now consolidating building up steam for the next leg up, however, this chap is still trading in the extremely oversold ranges and technically could mount a rally at any moment. However, note that this is a speculative play.

This company also trades in London under symbol GLEN (LSX: GLEN), and it is currently the world’s 4th largest nickel producer.  Risk-takers could deploy some capital in the 3.25-3.30 ranges and another lot deployed if it drops down to the 2.90-3.00 ranges. We would hold onto the third and deploy it after one of our customer indicators generates a buy signal.

Courtesy of Tactical Investor

Random views on Nickel Stocks

Use of nickel has been traced as far back as 3,500 BC. In more recent times nickel has been used in coins (a nickel), but is best known for its use in stainless steel driven mostly by Chinese construction. With the current negative sentiment due to the US-China trade war and some mild slowdown in China, nickel prices have fallen to a low level, as have the nickel miners. Provided we don’t head into a significant China or global slowdown, any resolution in the trade war with China should lead to some recovery in nickel prices and the nickel miner’s stock prices.Class 1 nickel demand forecast to increase 17 fold from 2017 to 2025 due to the EV boomAccording to McKinsey research if annual electric vehicle (EV) production reaches 31 million vehicles by 2025 as expected then demand for high-purity class 1 nickel is likely to increase significantly from 33 Kt in 2017 to 570 Kt in 2025. Class 1 nickel is the “high purity” nickel that is used in electric vehicle lithium ion batteries. The stainless steel industry uses both class 1 and class 2 nickel (lower purity) and is the main driver of overall nickel demand. Full Story

The share price of nickel mining stocks rose significantly in the Philippine Stock Exchange last week. This was driven by the sharp increase in the price of nickel traded in the London Metal Exchange (LME). The price of nickel is currently $14,860 per ton, up 17 percent compared to its end-June level and up 39 percent compared to its end 2018 level. This is despite the slowing global economic growth, which is pulling down the price of most commodities.

The higher price of nickel in LME is largely due to the steep drop in inventory levels. From 200,000 metric tons during the start of the year, LME’s inventory level fell to 160,000 MT as of end-June and is now down to 149,000 MT. This is equivalent to less than two months’ worth of supply and indicates a potential shortage, according to Jervois Mining executive general manager Michael Rodriguez, as reported by SmallCaps.com.

A reason for the decline in nickel inventory is growing demand for lithium-ion batteries used in electric vehicles. Note that various groups are projecting demand for electric vehicles to increase by a compounded annual growth rate of more than 20 percent in the next five to 10 years as governments globally are encouraging the adoption of electric vehicles due to environmental reasons. Consequently, demand for nickel used for electric vehicle batteries is also increasing and is expected to account for more than 50 percent of total nickel demand by 2030. Full Story


2016 was lithium’s year, 2017 was cobalt’s year, and 2018-2020 are likely to be nickel’s years as nickel inventories decline and nickel prices finally start to rise. Strong Chinese and global stainless steel demand and ever increasing demand from electric vehicles [EVs] using higher nickel content batteries NMC (8:1:1).

In this article the first 2 stocks are more solid and safe diversified nickel investments (with exposure to other metals) that will do ok even if the nickel boom is delayed until 2020. The last 3 stocks are nickel-cobalt optionality plays that can give out-sized returns should the nickel price continue to improve as I expect. They will also be helped significantly by strong cobalt prices. In all cases investors will need some patience with a 5 year plus investment time frame.

Nickel price and inventory

Nickel is only just recovering now from a severe bear market from 2012 to early 2016 (low of just below US$4/lb), with the price moving up in 2017 and reaching USD 6.10/lb by late January 2018. Inventory is finally slowly declining and price is recovering. Whilst some Philippine supply is expected to come back, the demand picture is strengthening as global economic growth picks up and the mass market EV boom begins.

In 2017 nickel prices rose 27.51% on the back of solid Chinese stainless steel demand. I expect something similar each year from now until 2020, as demand is steadily boosted from the EV boom. Full Story

Other Articles of Interest

Dollar hits bottom

US Dollar Finally Hit Bottom?

Updated 10 June 2024 The US Dollar Finally Hit Bottom, and Gold could be heading lower Gold USD: The theme ...
uranium futures price

Uranium Futures price chart

Updated 10 June 2024 Uranium futures price chart: Is Uranium Ready To Rally By any estimate, the uranium market is ...
stock market emotions chart

Sophistication in Sentiments: The Stock Market Emotions Chart Explained

Introduction Investing in the stock market can be a daunting task, especially for those unfamiliar with its fundamental rules. However, ...
how to win stock market game

The Artful Approach to Winning the Stock Market Game

Mastering the Art: How to Win the Stock Market Game We delved into this subject a few years back, using ...
permabear

The Permabear Predicament: A Ballet of Bearish Beliefs

Being a permabear is akin to a unique form of folly that even countless harsh lessons fail to rectify. It ...
The Dynamic Approach of Small Dogs Of the Dow

Harnessing Power: The Dynamic Approach of Small Dogs Of the Dow

For those new to the world of investing, the stock market can appear as a daunting labyrinth of stocks and ...
Exploring the Human Mind

Psychology Unveiled: Exploring the Depths of the Human Mind

Ahoy there, fellow explorer! It is an undeniable truth that the emotions within us drive the ebb and flow of ...
hologram of investor and chart

Stock Portfolio Tracker

Live Stock Portfolio Tracker with Analytics Please scroll down and register for an account. If you use the incognito mode, ...
stock market crashes

What happens if the stock market crashes?

The stock market has been a popular investment avenue for individuals and organizations for many years. Despite its popularity, many ...
Intelligent Investing

Achieving Financial Goals with Intelligent Investing Strategies

Intelligent investing strategies seek to minimize risk and maximize returns through the use of thoughtful, data-driven approaches. These strategies aim ...
Stock Market 2018 Graph

Stock market performance 2019

Stock Market 2018 Graph: The trend is your friend Stock market performance 2019: Financial experts continue to state that the ...
quantitative easing definition

Quantitative Easing Definition

Forever Quantitative Easing: Is it here to stay? The term forever QE has just started to come into play recently, ...
hologram of investor and chart

Stock Market Update

Stock Market Watch is our most popular and oldest stock market update service. As numerous upgrades and 2 upgrades are ...
Stock Market Quotes and Sayings

Stock Market Quotes and Sayings

Warren Buffett usually has produced a lot of great stock market quotes in regards to the discipline of investing; his ...
US Dow Jones Stock Outlook

US Dow Jones Outlook

US Dow Jones Stock Market Outlook Huge amounts of money have abandoned the marketplace, suggesting the audience is panicking at ...
Loading...

BitCoin VS Precious Metals

There is no absurdity so palpable but that it may be firmly planted in the human head if you only begin to inculcate it before the age of five, by constantly repeating it with an air of great solemnity. Arthur Schopenhauer

 Gold bottomed in 2002, and it took nine years for its trade to a high of roughly $1900 (September 2011). Contrast that to Bitcoin, in less than 1/3rd of the amount of time it is showing gains of more than 11,000%.  It took nine years for Gold to show gains of roughly 700% and Gold has given up a substantial portion of those gains.


We bailed out of Gold in 2011 for two reasons:

  • Gold was trading in the extremely overbought ranges, and the Gold Bug Camp could not contain their glee; they thought the sky was the limit. Instead, they found out that the Ground was a lot closer.
  • The masses were not embracing Gold, and they refused to treat or view it as a currency.

Only those from the hard money camp continued to believe that Gold was a currency,  but sadly their numbers are dwindling with the passage of each day. The masses view Bitcoin as cool and secure; a feat Gold has struggled to achieve and is not likely to achieve in the foreseeable future.  Whether this is true or not, hardly matters for when it comes to investing, perceptions are all that matter.

Does this mean the precious metals sector is dead?

Well, that depends on what one means by dead.   Gold has performed abysmally since (it topped out)  2011.  The money supply soared, and Gold tanked, not exactly a good sign. In doing the opposite of what was expected from it, Gold cemented the view that it was an ancient relic that has no place in today’s monetary system. We are speaking in terms of Mass Perception. What we think, matters not; we follow trends, and we don’t waste time trying to look at things from a personal vantage point.  There are many reasons for Gold’s underperformance after 2011; one of them was the “velocity of the money supply” which all but stalled after 2011. However, the masses don’t waste time on details like this. They look for simple cause and effect answers. Money supply soared, Gold did nothing, and hence Gold is a waste of time.  A bit simplistic but that’s the mass mindset for you.  However, looking forward some factors could limit Gold’s lustre

Demand for Gold continues to drop

 India’s gold consumption is likely to drop to its lowest in eight years in 2017, hit by government moves to make bullion trading more transparent and by faltering demand from some rural areas, the World Gold Council (WGC) said on Thursday.

Evidence of weaker appetite in a country where gold is used in everything from investment to wedding gifts could drag on global prices that have been hovering near their highest in three weeks. India is the word’s No 2 consumer of gold behind China. Full Story

The Dollar appears to be putting in a base

US dollar ready to rally in 2018, Good for Bitcoin bad for Gold

The dollar topped in early 2017 and what did Gold do? Absolutely nothing; instead of surging to new highs it could not even trade past its July 2016 highs.  The dollar, in contrast, has been going through a well deserved period of consolidation after mounting a stunning rally that started in 2011.  It tested support and held, and as long as it does not close below 90 on a monthly basis, the outlook will remain bullish.  Consequently, a monthly close above 94.50 will open the possibility for a test of the old highs.

Conclusion

The dollar is getting ready to mount a rally, demand for Gold is declining, and Gold has been unable to trade past $1350 even in the face of a weaker dollar.   Then we have the Bitcoin market, which the masses (especially millennia’s) find to be a lot more exciting and rewarding than Gold. All these factors don’t bode well for Gold.  It appears that Gold is likely to test the 1000 ranges unless it decides to diverge and trend upwards in tandem with the dollar.   Bitcoin, on the other hand, is now in the feeding frenzy stage, so this market is ripe for a correction. However, the upward move is still not over. After a hard correction, Bitcoin is likely to resume its upward trend.

Gold will probably never experience a move akin to that of Bitcoin, but that does not mean it won’t make for a good investment one day. For now, the trend is neutral;  a weekly close below $1100 will darken the outlook for Gold, but a monthly close above $1350 will indicate that Gold is ready to trend higher.

Word to the wise

Never fall in love with any investment.  In the end, it’s the trend that you should pay attention to, for no sector can trend upwards forever.  The odds of the Dow trading to 29,000 are far better than of Gold trading to $1900.


Published courtesy of the Tactical Investor


Other Articles of Interest

Dollar hits bottom

US Dollar Finally Hit Bottom?

Updated 10 June 2024 The US Dollar Finally Hit Bottom, and Gold could be heading lower Gold USD: The theme ...
uranium futures price

Uranium Futures price chart

Updated 10 June 2024 Uranium futures price chart: Is Uranium Ready To Rally By any estimate, the uranium market is ...
stock market emotions chart

Sophistication in Sentiments: The Stock Market Emotions Chart Explained

Introduction Investing in the stock market can be a daunting task, especially for those unfamiliar with its fundamental rules. However, ...
how to win stock market game

The Artful Approach to Winning the Stock Market Game

Mastering the Art: How to Win the Stock Market Game We delved into this subject a few years back, using ...
permabear

The Permabear Predicament: A Ballet of Bearish Beliefs

Being a permabear is akin to a unique form of folly that even countless harsh lessons fail to rectify. It ...
The Dynamic Approach of Small Dogs Of the Dow

Harnessing Power: The Dynamic Approach of Small Dogs Of the Dow

For those new to the world of investing, the stock market can appear as a daunting labyrinth of stocks and ...
Exploring the Human Mind

Psychology Unveiled: Exploring the Depths of the Human Mind

Ahoy there, fellow explorer! It is an undeniable truth that the emotions within us drive the ebb and flow of ...
hologram of investor and chart

Stock Portfolio Tracker

Live Stock Portfolio Tracker with Analytics Please scroll down and register for an account. If you use the incognito mode, ...
stock market crashes

What happens if the stock market crashes?

The stock market has been a popular investment avenue for individuals and organizations for many years. Despite its popularity, many ...
Intelligent Investing

Achieving Financial Goals with Intelligent Investing Strategies

Intelligent investing strategies seek to minimize risk and maximize returns through the use of thoughtful, data-driven approaches. These strategies aim ...
Stock Market 2018 Graph

Stock market performance 2019

Stock Market 2018 Graph: The trend is your friend Stock market performance 2019: Financial experts continue to state that the ...
quantitative easing definition

Quantitative Easing Definition

Forever Quantitative Easing: Is it here to stay? The term forever QE has just started to come into play recently, ...
hologram of investor and chart

Stock Market Update

Stock Market Watch is our most popular and oldest stock market update service. As numerous upgrades and 2 upgrades are ...
Stock Market Quotes and Sayings

Stock Market Quotes and Sayings

Warren Buffett usually has produced a lot of great stock market quotes in regards to the discipline of investing; his ...
US Dow Jones Stock Outlook

US Dow Jones Outlook

US Dow Jones Stock Market Outlook Huge amounts of money have abandoned the marketplace, suggesting the audience is panicking at ...
Loading...

Bull and Bear 2019: Which one is the winner?

Bull and Bear 2019

Bull and bear market: Before we get into any commentary take a look at the images and charts below.  Remember that the best time to buy from a long term perspective is when blood is flowing freely in the streets and blood is flowing now. Finally, keep in mind that we have always advocated that crashes are nothing but long term buying opportunities. Pull up a long term chart and you will be forced to arrive at the same conclusion.The Big player’s game strategy is to get individuals to focus on words such as bear market, crash, and end of the world, etc; in doing so, the crowd focuses on the tree and forgets the forest.

Anxiety Index - Tactical Investor

Source: Tactical Investor

The anxiety gauge has red-lined, and the gauge is in unchartered territory;  it has set an all-time new high.

Bull and Bear Chart - Tactical Investor

Source: Tactical Investor

Bearish sentiment is approaching the seven-year high level. Fear and hysteria are trading at off the chart levels.  Mass psychology states that stock markets never crash when the masses are in a state of panic.   Bull markets emerge when the masses panic, so forgot about the what happens if the stock market crashes scenario? If it does crash, run out and buy all the top companies; from a long term perspective stock market crashes are fantastic buying opportunities.

If things were declining retail sales would not be improving. Holiday season retail sales are set to exceed the $ one trillion mark for the first time.

Holiday Season Retail Sales

Source: emarketer.com

Random Views on Stock Market Bull and Bear 2019

Big-money investors see the bull market ending in 2019

  • Institutional investors believe the bull market in stocks will come to an end over the next 12 months.
  • They also expect the next financial crisis to come in one to five years, according to a Natixis survey.
  • The results come as market tumult has left stocks barely positive for 2019.

The longest bull market run in history is coming to an end in 2019, according to the pros who handle Wall Street’s big-money clientele.

A survey of institutional investors show that 65 percent see a change coming, with the biggest threats being geopolitical tensions and rising interest rates, according to Natixis, which surveyed 500 managers of pension funds, endowments, foundations and the like. Respondents also included sovereign wealth funds and insurance funds.

In addition to seeing the bull market stopping, they also anticipate the next financial crisis coming in one to five years.

Despite the pessimism over where the market is heading, the collective portfolio allocation to stocks is expected to dip only slightly — from 38 percent to 36 percent. But 41 percent of those surveyed said they will be reducing allocation to U.S. equities.

Allocations are expected to increase slightly for bonds, from 37 percent to 38 percent, and cash, from 5 percent to 6 percent.

“The market is catching up to what they’ve been thinking about. I think they’ve been positioned for this for quite a while,” he said. “For the most part they’re staying put, except U.S. equities.” Full Story

Opinion: A bear market and 6 other forecasts for 2019

A new year is usually a time for fresh starts and empty promises. But investors begin 2019 in a state of high anxiety.

That’s because despite a post-Christmas rally, stocks still had their worst December since 1931 and their worst year since 2008 (both ominous comparisons). By Christmas Eve, the S&P 500 SPX, +0.00% was within 0.2 percentage points of a 20% bear-market decline, before a Santa rally kicked in.

So are we in a bear market? Is recession around the corner? And how will Democratic control of the House of Representatives and the looming 2020 presidential election affect markets this year? Here’s my take.

1. A trade deal with China will boost markets and investors’ confidence. President Trump already has hinted (or tweeted) that trade talks with Chinese President Xi Jinping are making “big progress.” Both men really need a deal—Xi, because of the slowing Chinese economy, and Trump, because of plunging stock prices.

I expect they will cut a cosmetic deal in which Xi makes some concessions, but ultimately Trump will cave on his major demands, as he did with North Korea (which still shows no sign of real denuclearization). But both will declare victory and that will be good enough for hardcore Trumpkins and for Wall Street, which just wants markets to go up.
So stocks will rally sharply… Full Story

Will 2019 be a Bear Market or Bull Market?

AK has been an analyst at long/short equity investment firms, global macro funds, and corporate economics departments. He co-founded Macro Ops and is the host of Fallible.

Is The 2019 Stock Market Crash Over? Or Will The Bear Market Continue?
In this video we’ll do a quick market review to see whether we’re headed higher from here in stocks or if the bear is still creeping behind the corner.

The market is battling through the major supply overhang (red zone) that I pointed out a few weeks ago. I’d expect a selloff from these levels over the next few weeks. This bounce is technically overextended (price is near the upper Bollinger Band) and one more good washout would really set the stage (both from a technical and sentiment point of view) for another major leg higher.

Of course, we don’t need to see a selloff. We could see persistent strength and have the market move higher from here. But, I believe it’s odds on we see a reversal before the market makes another major move.

The market has so far, though, given us a number of things to be optimistic about. Both credit and Cyclical vs Defensives have been confirming this rally; which is just the type of action we need to see in order for a significant bottom to be in place.

And various breadth indicators are showing extremely large buying pressure coming into the market. My longer-term breadth indicator is moving in the right direction. Full Story

Conclusion

The correction of 2008 was warranted as the masses were euphoric in terms of the housing sector; it took a turn for the worse when Lehman brothers were purposely thrown to the curb by the Fed.  Regardless of this development, you can see that the markets were trading in the extremely overbought ranges and masses were euphoric.

The same sequence of events occurred during the dot.com bubble and the not too late Bitcoin bubble. If there were charts, we could demonstrate the exact setup going back all the way to the tulip bubble.  The masses are not euphoric and the markets are not overbought; hence the current pullback most likely falls into the “opportunity” category.


Other Articles of Interest

Bear Market nonsense: Experts want you to think Markets are Going to Crash 

Updated 10 June 2024 Are We headed for A Bear Market? The stock market crash story is getting boring and annoying ...
Dollar hits bottom

US Dollar Finally Hit Bottom?

Updated 10 June 2024 The US Dollar Finally Hit Bottom, and Gold could be heading lower Gold USD: The theme ...
uranium futures price

Uranium Futures price chart

Updated 10 June 2024 Uranium futures price chart: Is Uranium Ready To Rally By any estimate, the uranium market is ...
stock market emotions chart

Sophistication in Sentiments: The Stock Market Emotions Chart Explained

Introduction Investing in the stock market can be a daunting task, especially for those unfamiliar with its fundamental rules. However, ...
how to win stock market game

The Artful Approach to Winning the Stock Market Game

Mastering the Art: How to Win the Stock Market Game We delved into this subject a few years back, using ...
permabear

The Permabear Predicament: A Ballet of Bearish Beliefs

Being a permabear is akin to a unique form of folly that even countless harsh lessons fail to rectify. It ...
The Dynamic Approach of Small Dogs Of the Dow

Harnessing Power: The Dynamic Approach of Small Dogs Of the Dow

For those new to the world of investing, the stock market can appear as a daunting labyrinth of stocks and ...
Exploring the Human Mind

Psychology Unveiled: Exploring the Depths of the Human Mind

Ahoy there, fellow explorer! It is an undeniable truth that the emotions within us drive the ebb and flow of ...
hologram of investor and chart

Stock Portfolio Tracker

Live Stock Portfolio Tracker with Analytics Please scroll down and register for an account. If you use the incognito mode, ...
stock market crashes

What happens if the stock market crashes?

The stock market has been a popular investment avenue for individuals and organizations for many years. Despite its popularity, many ...
Intelligent Investing

Achieving Financial Goals with Intelligent Investing Strategies

Intelligent investing strategies seek to minimize risk and maximize returns through the use of thoughtful, data-driven approaches. These strategies aim ...
Stock Market 2018 Graph

Stock market performance 2019

Stock Market 2018 Graph: The trend is your friend Stock market performance 2019: Financial experts continue to state that the ...
quantitative easing definition

Quantitative Easing Definition

Forever Quantitative Easing: Is it here to stay? The term forever QE has just started to come into play recently, ...
hologram of investor and chart

Stock Market Update

Stock Market Watch is our most popular and oldest stock market update service. As numerous upgrades and 2 upgrades are ...
Stock Market Quotes and Sayings

Stock Market Quotes and Sayings

Warren Buffett usually has produced a lot of great stock market quotes in regards to the discipline of investing; his ...
US Dow Jones Stock Outlook

US Dow Jones Outlook

US Dow Jones Stock Market Outlook Huge amounts of money have abandoned the marketplace, suggesting the audience is panicking at ...
Loading...


Buffett Indicator: Pure Nonsense

Buffett Indicator 2019

The Stock Market is going to Crash; that’s the rubbish experts want you to believe 

One jackass (oops we mean expert) after another, has been predicting that a Stock Market Crash is coming.  The problem is that these brain surgeons have been making this argument for so long it almost sounds like the definition of insanity. Insanity boils down to doing the same thing over and over again and hoping for a new outcome. These predictions are so off the mark that they make a broken clock look fantastic which happens to be right once or twice a day depending on whether you follow military time or not.

Some Experts point out that Warren Buffet is betting on a Stock Market Crash

This claim is based on the fact that Buffett is sitting on $86 billion in cash. They use this information to create the illusion that this Buffett Indicator 2019 is predicting a stock market crash.

To us, this seems like the ramblings of an insane individual. Just because Warren Buffett is sitting on billions of cash does not mean he is waiting for the market to crash. He is probably waiting for a good deal; that’s all.

Some might point out that it’s the biggest hoard of cash the company has ever built up and that this indicates that Buffett is nervous. Being nervous does not equate to betting on a stock market crash. Buffett is a valuable player and he is looking for a deal, so correction not crash might be all he is waiting for.

Buffett Does not believe stocks are overpriced; hence he is not expecting a stock market crash

While Buffett agrees the market can go through a period of turbulence, he stated that   “no one can tell you when these traumas occur.”

“American business—and consequently a basket of stocks—is virtually certain to be worth far more in the years ahead. Innovation, productivity gains, entrepreneurial spirit and an abundance of capital will see to that,” Buffett said.

Bottom Line Buffett would view these pullbacks that could range from mild to extreme as buying opportunities and so do we.

In a recent article, Buffett stated that stocks were on the cheap side; one does not make a comment like this if one believes the stock market is going to crash

The Buffett Indicator of 2019 Is Predicting a Stock Market Crash theory is not valid based on Market Sentiment

This market is unlike any other market; it has moved from being the most hated bull market to the most insane bull market (fanaticism stock market crash) of all time. In such an environment technical analysis is technically trash and fundamentals are fundamentally flawed. In fact, for the most part, market technicians have no idea of what they are talking about; they figure that by studying someone else theory or drawing squiggly lines on some chart they can decipher the market.

We have dealt with at least 15 so-called expert technicians who claimed to have found the Holy Grail; in the end, their theory was full of holes and could not account for sudden and rapid trend changes. Technical’s do not drive the markets, and neither do fundamentals; emotions drive the market. Understand the emotion, and you can identify the trend. Identify the trend, and you can determine the primary direction of the market. If the trend is up, then you don’t need to worry about crashes or correction; the market will not crash when the primary trend is up. It will, however, experience corrections, all of which will prove to be buying opportunities until the trend changes.

Simple, prudent money management skills will protect your profits and reduce your losses.  Fundamental analysis is even worse; at least technical analysis can be useful when combined with sentiment analysis. Fundamentals boil down to pouring over standard data, and you are usually looking at what happened and not what will happen. We will not spend more time on that topic as in our opinion fundamental analysis is in today’s markets is a total waste of time.

The NASDAQ achieved a very important milestone and does not support a Stock Market Crash Scenario

NASDAQ stock market crash

Experts almost always fall into the category of “all talk but no action.”

What many experts fail to understand is that a bull market starts only after the old high has been taken out. Until that occurs, it’s not a real bull market. In that sense, the NASDAQ bull has just started. For over 15 years the NASDAQ struggled to overcome this hurdle. Jack in the box is what comes to mind; so like a coiled spring, it is ready to trade a lot higher before it breaks down.  The NASDAQ has already broken past the psychologically (contrarian investing) significant 6000 level, so the odds are fair to high that it should roughly double from its breakout point; a move to the 9000-10,000 ranges might appear insane now. Experts would have felt the same way if someone told them that the Dow would be trading past 21K after it dropped below 7,000 in 2009.

Don’t expect the upward journey to be smooth; the higher the Nasdaq trades, the more volatile the ride will be. In the interim, it would not surprise us if the Nasdaq eventually dropped down to the 5200-5400 ranges with a possible overshoot to 5,0000 before testing 6700.

The Crowd is Nervous Proving that Stock Market crash Mantra is Not Valid

Sentiment continues to paint a fascinating picture as it indicates that for the 1st time in decades the crowd is not driven by panic or euphoria.They are uncertain, and uncertainty is the 1st stage of fear, indicating that the markets are a very long way off from hitting the Euphoric zone.

Overall, looking at the situation from a mass psychology perspective what we stated in 2014, 2015 and 2016, continues to hold; this bull market could end up running a lot higher than the most ardent of bulls could ever envision. It has already caught some of the most ardent of bulls by surprise; some of them even turned negative this January.

Tactical Investor Stock Market Chart

Tactical Investor Anxiety Index

54% of Americans Have $0 Invested in Stocks 

Furthermore, according to CNN most Americans are not investing in the stock market

“I have a little bit in my checking [account], a little bit in my savings,” Coomer, a grandma of three who still works 55 hours a week at the gas station, told CNNMoney. Coomer is part of over half of America that has $0 invested in the stock market, as research reports and surveys have found. One survey from Bankrate found that 54% of Americans have no money in the stock market.

That means no money in pension funds, 401(k) retirement plans, IRAs, mutual funds or ETFs. “For the majority of the people here, the stock market is something interesting to look at,” says Chuck Caudill, general manager of the local newspaper, The Beattyville Enterprise.

Therefore until the masses embrace the market, this bull will trend a lot higher as the only way the top players can bank their paper profits is to unload these shares onto the unsuspecting masses.  Many would point out that the masses are broke.  Banks and various lending clubs are already offering unsecured personal loans ranging from $2,000 all the way to $100,000. However, we expect the rates to drop even further but more importantly supportive documentation requirements will be dropped to a bare minimum.  We will move back to the era of Liar Loans

Two factors invalidate the Buffett Indicator Is Predicting a Stock Market Crash Hypothesis

A back breaking correction needs at least two elements; the masses should be euphoric, and the market needs to be trading in the extremely overbought ranges. At the moment, the market satisfies only one of these conditions. A small wave of selling will propel the masses into the hysteria zone, which will create a mouth-watering opportunity. Markets don’t crash when the masses are in disarray; they crash when the crowd is jumping up with Joy.  The experts will probably confuse the next correction for a crash, but what can one expect from individuals who have been on the wrong side of this Bull market since its inception.

Naysayers are trying to Con the Masses into Believing a Stock Market Crash is around the Corner

This Video Illustrates How the Crowd is manipulated: Fear Mongers love to sell Stock Market Crash and other Doomsday scenarios.  Misery Loves Company so don’t fall for the nonsense that the Buffett indicator is predicting a stock market Crash mumbo jumbo prediction. Instead, try to view stock market crashes as buying opportunities for until Fiat is eliminated the markets will always trend upwards.

Published courtesy of the Tactical Investor

Other Articles of Interst

Bear Market nonsense: Experts want you to think Markets are Going to Crash 

Updated 10 June 2024 Are We headed for A Bear Market? The stock market crash story is getting boring and annoying ...
Dollar hits bottom

US Dollar Finally Hit Bottom?

Updated 10 June 2024 The US Dollar Finally Hit Bottom, and Gold could be heading lower Gold USD: The theme ...
uranium futures price

Uranium Futures price chart

Updated 10 June 2024 Uranium futures price chart: Is Uranium Ready To Rally By any estimate, the uranium market is ...
stock market emotions chart

Sophistication in Sentiments: The Stock Market Emotions Chart Explained

Introduction Investing in the stock market can be a daunting task, especially for those unfamiliar with its fundamental rules. However, ...
how to win stock market game

The Artful Approach to Winning the Stock Market Game

Mastering the Art: How to Win the Stock Market Game We delved into this subject a few years back, using ...
permabear

The Permabear Predicament: A Ballet of Bearish Beliefs

Being a permabear is akin to a unique form of folly that even countless harsh lessons fail to rectify. It ...
The Dynamic Approach of Small Dogs Of the Dow

Harnessing Power: The Dynamic Approach of Small Dogs Of the Dow

For those new to the world of investing, the stock market can appear as a daunting labyrinth of stocks and ...
Exploring the Human Mind

Psychology Unveiled: Exploring the Depths of the Human Mind

Ahoy there, fellow explorer! It is an undeniable truth that the emotions within us drive the ebb and flow of ...
hologram of investor and chart

Stock Portfolio Tracker

Live Stock Portfolio Tracker with Analytics Please scroll down and register for an account. If you use the incognito mode, ...
stock market crashes

What happens if the stock market crashes?

The stock market has been a popular investment avenue for individuals and organizations for many years. Despite its popularity, many ...
Intelligent Investing

Achieving Financial Goals with Intelligent Investing Strategies

Intelligent investing strategies seek to minimize risk and maximize returns through the use of thoughtful, data-driven approaches. These strategies aim ...
Stock Market 2018 Graph

Stock market performance 2019

Stock Market 2018 Graph: The trend is your friend Stock market performance 2019: Financial experts continue to state that the ...
quantitative easing definition

Quantitative Easing Definition

Forever Quantitative Easing: Is it here to stay? The term forever QE has just started to come into play recently, ...
hologram of investor and chart

Stock Market Update

Stock Market Watch is our most popular and oldest stock market update service. As numerous upgrades and 2 upgrades are ...
Stock Market Quotes and Sayings

Stock Market Quotes and Sayings

Warren Buffett usually has produced a lot of great stock market quotes in regards to the discipline of investing; his ...
US Dow Jones Stock Outlook

US Dow Jones Outlook

US Dow Jones Stock Market Outlook Huge amounts of money have abandoned the marketplace, suggesting the audience is panicking at ...
Loading...

Experts Are Not Smart Enough to Spot Stock Market Crash 2017

Stock Market Crash 2017

Stock Market Crash 2017 boils down to all bark and no bite 

For the past few years much the angst of many experts we have consistently stated that the markets were not ready to crash. Moreover, we believe that Experts are not Smart Enough to Spot Stock Market Crash 2017. If they were they would not have made the same predictions in 2014, 2015 and 2016. All these predictions of disasters proved to be nothing but idle chatter.
From late 2016 to early 2017, many former Bulls who predicted the direction of this market quite well, suddenly decided that the stock market was ready to crash. We, however, begged to differ, and we provided two very simple reasons for our stance.

Experts Fail To Realise that Emotions drive the markets:

The masses have remained nervous throughout this bull run; no bull market has ever ended when the masses are nervous.  History indicates that stock market crashes begin on a euphoric note and end on a note of hysteria.

The trend clearly states that the Experts are on the wrong side of the Stock Market Crash 2017 argument 

We focus more on the psychology of the masses than on any other single factor. However, the 2nd most important factor is the trend. The trend has remained positive throughout this bull run; occasionally it has moved into the neutral zone, but it has never turned negative.  We are not talking about the trend based on the drawing of simple trend lines but one that is calculated utilizing several factors one of which happens to price action.

So when the experts started to scream over and over again about the impending stock market crash of 2017; these are some of the comments we recently made to our readers and or subscribers

Let the experts sing their songs of doom and con the masses; it takes two to tango, one to cry and three to have a party. We have experts from the technical analysis side and experts employing fundamentals trying to use to back their faulty assertions. Unfortunately for these penguins both of them are wrong. They have failed to pay attention to the psychological factor. There is no factor more important when it comes to playing the markets then market psychology.  Market Update April 30, 2017

The market marches to its beat and those that resist are drained; financially speaking that is.  We are not fortune tellers; we reserve that noteworthy task for the experts who seem to take delight on spewing rubbish week after week. The media then regurgitates this rubbish, and a jackass is suddenly made to look like a movie star. What a wonderful world we live in and people wonder why they lose money after listening to these wise men.

We, on the other hand, prefer to listen to what the market is saying and that is why we never listen to our gut instinct or let our emotions into the equation.  We look for trends. Market Update May 19, 2017

Stock market crash anxiety index

 What’s The most nonplussing factor in this bull market?

The emotional state of the masses; the herd, for the most part, has been oscillating back and forth from the neutral to the Bearish camps; very few have dared to venture into the bullish camp. This probably explains why the bullish readings never even came close to testing the 60% ranges for the past 15 weeks and counting. During that time the market has been trending higher and higher. This has caught many an expert with his pants down. But there is no surprise here; the reason as we have stated so many times over and over again is that the Crowd is not euphoric and the trend is still bullish.


The same pattern holds true for most of 2015 and 2016; the number individuals in the Bearish and neutral camps outnumbered those in the bullish camp. If you are in the Neutral camp one of two things one of two things apply; you are either are a bear that got burned or Bull with no courage to take a position.

Our proprietary sentiment indicator also confirms that the masses are still antsy.

Market Structure

If the markets were extremely overbought, then it should be almost impossible to find stocks that are trading in the oversold ranges on the monthly charts. On a monthly chart, each bar represents one month’s worth of data on; these charts provide great clues of what to expect from the markets.

In the Dow, we spotted several stocks that were trading in the extremely oversold ranges to oversold ranges on the monthly charts.  AAPL, HD, DIS and NKE are examples of such stocks.

We also examined roughly 150 random Midcap to large cap stocks (ETF’s were included in this analysis) from various sectors; we found that almost 60% of the stocks examined were trading in the oversold ranges; one ETF that caught our eye was IBB; it is trading in the extremely oversold ranges.

We also noted that the net number of new 52 week highs continuously exceeded the net number of new 52 week lows. Why is this important? It indicates that the internal structure of the market is healthy.

Tactical investors Alternative Dow theory states that the experts have it wrong

Our stance for the past 11 years has been that the Dow Theory is dead; we provided an alternative Dow Theory that has proven to be far more accurate than the original.  This theory states that it is the utilities that should be followed and not the transports. We will cover this in more detail in a follow-up article next week. In essence, it is the Utilities that lead the way and not the transports.

Tactical investors Alternative Dow theory states that the experts have it wrong

The utilities started to consolidate roughly from Aug of 2016 and bottomed out in Nov 2016 and had consolidated for roughly three months before they started to trend upwards. The utilities are now surging to new highs, and this bodes well for the overall market. The alternative theory states that the Dow should follow suit.

This is a mature bull market so one should not expect it to trend in one direction only; it will experience several corrections ranging from mild to severe. Unfortunately, the Dr’s of doom will confuse this correction for a crash as they have mistakenly done so for the past eight years and counting. When the masses embrace this market, the end will be close at hand; until then strong corrections should be embraced.

Dow theory states experts wrong

There is a lag period between the utilities and the Dow; sometimes it comes down to just a few weeks, but usually, it ranges from 3-5 months.  The Dow has been consolidating since March; it has essentially been trading in a tight range. Even though the Dow did not pull back strongly, the sideways action helped it blow out a large dose of steam as envisioned by the MACD’s and several other technical indicators that are trading in the oversold ranges. The lag period was roughly three months as the utility bottomed out in Nov and the Dow started to consolidate in March of 2017.


The stock market crash theme makes for great headlines as fear sells well, but that is all it has been good for so far.  The market will experience a much stronger correction over the course of the next 6-15 months, but until the masses embrace this bull market, those corrections will prove to be buying opportunities.

The overall Market sentiment illustrates that the masses are not jumping with joy.  The trend is positive, and the Dow Utilities have surged to new highs.  Therefore under such conditions, it is hard to envision a crash like a scenario.

Every bull market experiences one back breaking correction that is mistakenly labelled as the beginning of a new bear market. When that occurs, it will be a sign that the end is close at hand. That strong correction will subsequently trigger an even stronger rally and fuel a feeding frenzy. Sentiment will turn bullish, and the masses will dance with Joy, then the bottom will drop. However, we are not at this stage, so there is no point in further developing this story line.

Our ideal setup would call for the Dow to shed 600-1000 points over a very short period; this would drive the masses into the hysteria zone. A small push is all it would take to drive the fear factor through the roof. We all know what happens next; the masses stampede, the smart money swoops in, and history repeats itself once again. For the masses, it is groundhogs day every single day.


A genius can’t be forced; nor can you make an ape an alderman.

Thomas Somerville


Published courtesy of the Tactical Investor


Other Articles of Interst

Bear Market nonsense: Experts want you to think Markets are Going to Crash 

Updated 10 June 2024 Are We headed for A Bear Market? The stock market crash story is getting boring and annoying ...
Dollar hits bottom

US Dollar Finally Hit Bottom?

Updated 10 June 2024 The US Dollar Finally Hit Bottom, and Gold could be heading lower Gold USD: The theme ...
uranium futures price

Uranium Futures price chart

Updated 10 June 2024 Uranium futures price chart: Is Uranium Ready To Rally By any estimate, the uranium market is ...
stock market emotions chart

Sophistication in Sentiments: The Stock Market Emotions Chart Explained

Introduction Investing in the stock market can be a daunting task, especially for those unfamiliar with its fundamental rules. However, ...
how to win stock market game

The Artful Approach to Winning the Stock Market Game

Mastering the Art: How to Win the Stock Market Game We delved into this subject a few years back, using ...
permabear

The Permabear Predicament: A Ballet of Bearish Beliefs

Being a permabear is akin to a unique form of folly that even countless harsh lessons fail to rectify. It ...
The Dynamic Approach of Small Dogs Of the Dow

Harnessing Power: The Dynamic Approach of Small Dogs Of the Dow

For those new to the world of investing, the stock market can appear as a daunting labyrinth of stocks and ...
Exploring the Human Mind

Psychology Unveiled: Exploring the Depths of the Human Mind

Ahoy there, fellow explorer! It is an undeniable truth that the emotions within us drive the ebb and flow of ...
hologram of investor and chart

Stock Portfolio Tracker

Live Stock Portfolio Tracker with Analytics Please scroll down and register for an account. If you use the incognito mode, ...
stock market crashes

What happens if the stock market crashes?

The stock market has been a popular investment avenue for individuals and organizations for many years. Despite its popularity, many ...
Intelligent Investing

Achieving Financial Goals with Intelligent Investing Strategies

Intelligent investing strategies seek to minimize risk and maximize returns through the use of thoughtful, data-driven approaches. These strategies aim ...
Stock Market 2018 Graph

Stock market performance 2019

Stock Market 2018 Graph: The trend is your friend Stock market performance 2019: Financial experts continue to state that the ...
quantitative easing definition

Quantitative Easing Definition

Forever Quantitative Easing: Is it here to stay? The term forever QE has just started to come into play recently, ...
hologram of investor and chart

Stock Market Update

Stock Market Watch is our most popular and oldest stock market update service. As numerous upgrades and 2 upgrades are ...
Stock Market Quotes and Sayings

Stock Market Quotes and Sayings

Warren Buffett usually has produced a lot of great stock market quotes in regards to the discipline of investing; his ...
US Dow Jones Stock Outlook

US Dow Jones Outlook

US Dow Jones Stock Market Outlook Huge amounts of money have abandoned the marketplace, suggesting the audience is panicking at ...
Loading...